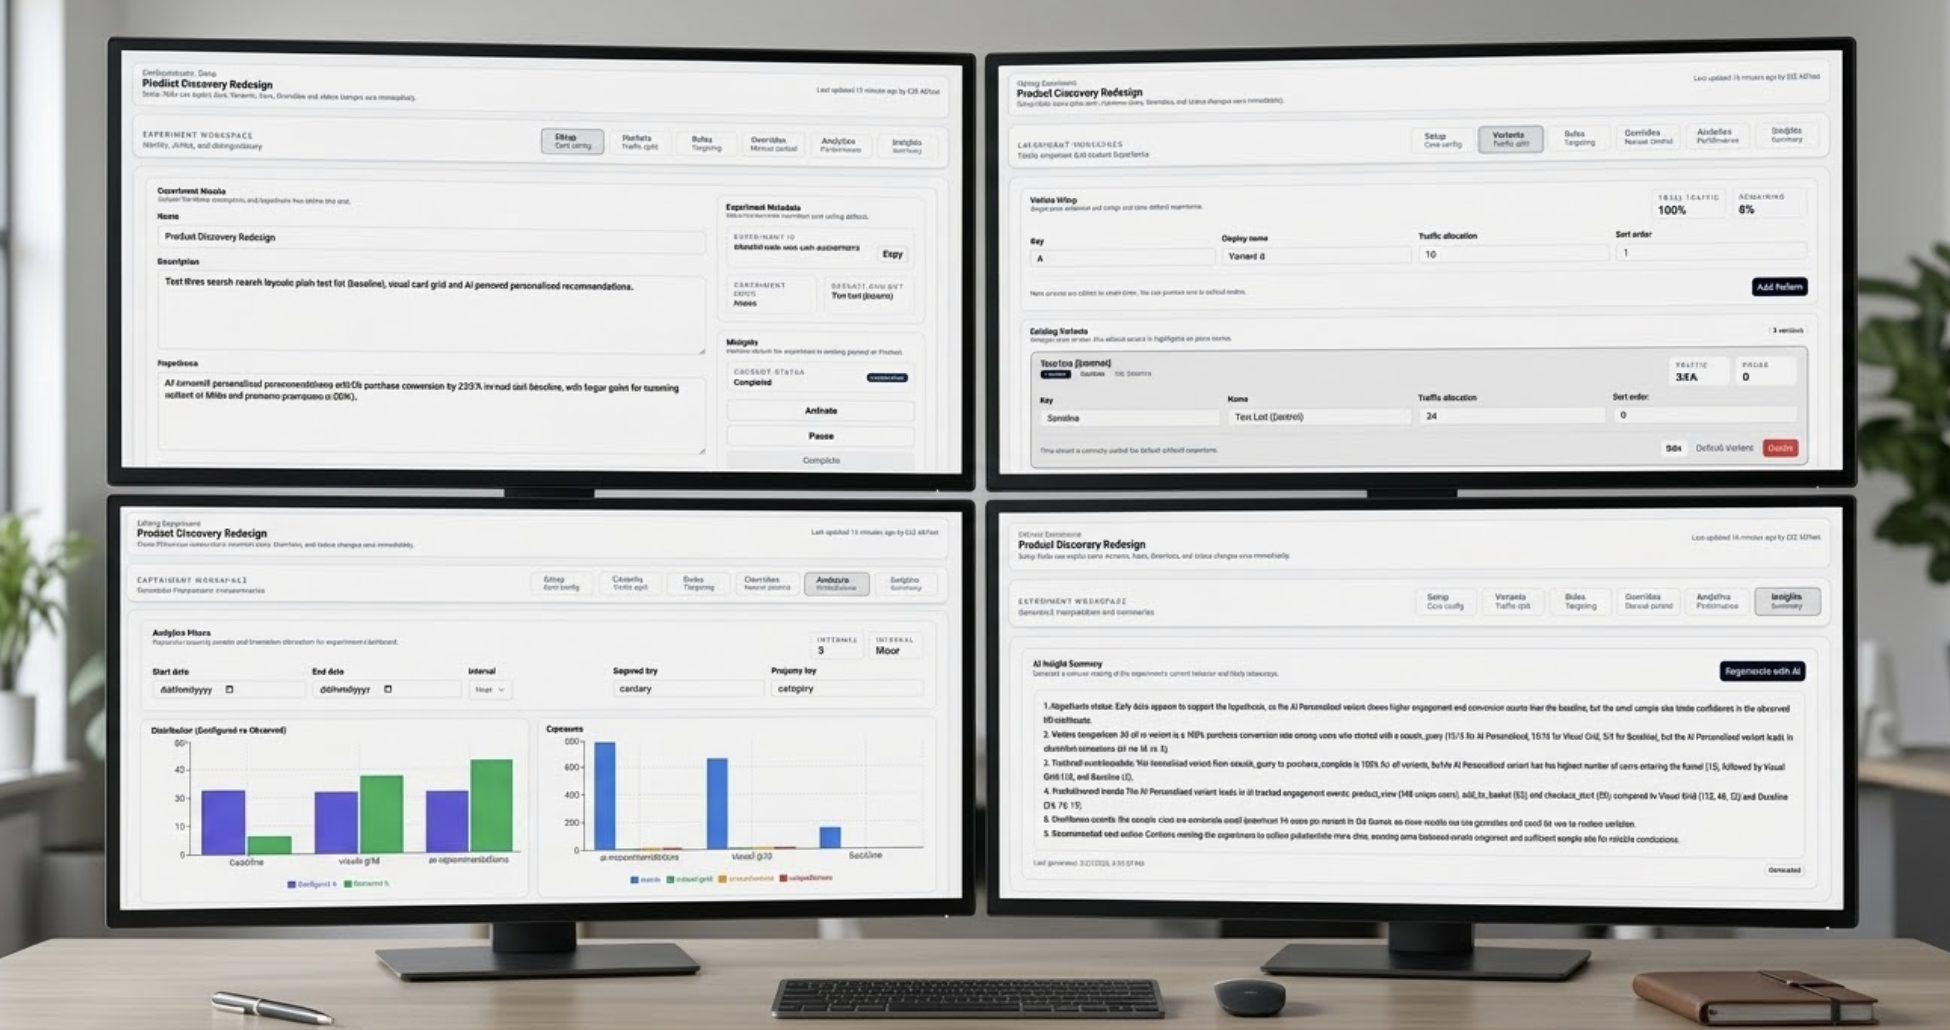
Experiments - User Guide
Flash Analytics Experiments lets you run deterministic A/B tests for users, sessions, or events, then measure conversion and behavior directly from your event stream.
Flash Analytics Experiments lets you run A/B tests that deterministically assign users, sessions, or events to variants, then measure conversion and behavior outcomes directly from your event stream.
Table of Contents
- Creating an Experiment
- Setup Tab - Core Config
- Variants Tab - Traffic Split
- Rules Tab - Targeting
- Overrides Tab - Manual Control
- Analytics Tab - Performance
- Insights Tab - AI Summary
- SDK Integration
- Caveats and Gotchas
1. Creating an Experiment
From the Experiments list page, click Create New in the top right.
Fill in a name, description if needed, and choose the Assignment Mode.
| Mode | When to use |
|---|---|
| profile | Sticky per user across sessions. The same user always gets the same variant. |
| session | Sticky within a single session only. The same user can get a different variant next visit. |
| event | Non-sticky, per-event random. Use when each event should be independently assigned. |
Caveat: Assignment mode cannot be changed after the experiment is created. Pick the right mode before you activate.
Once created, the experiment opens in the editor.
2. Setup Tab - Core Config
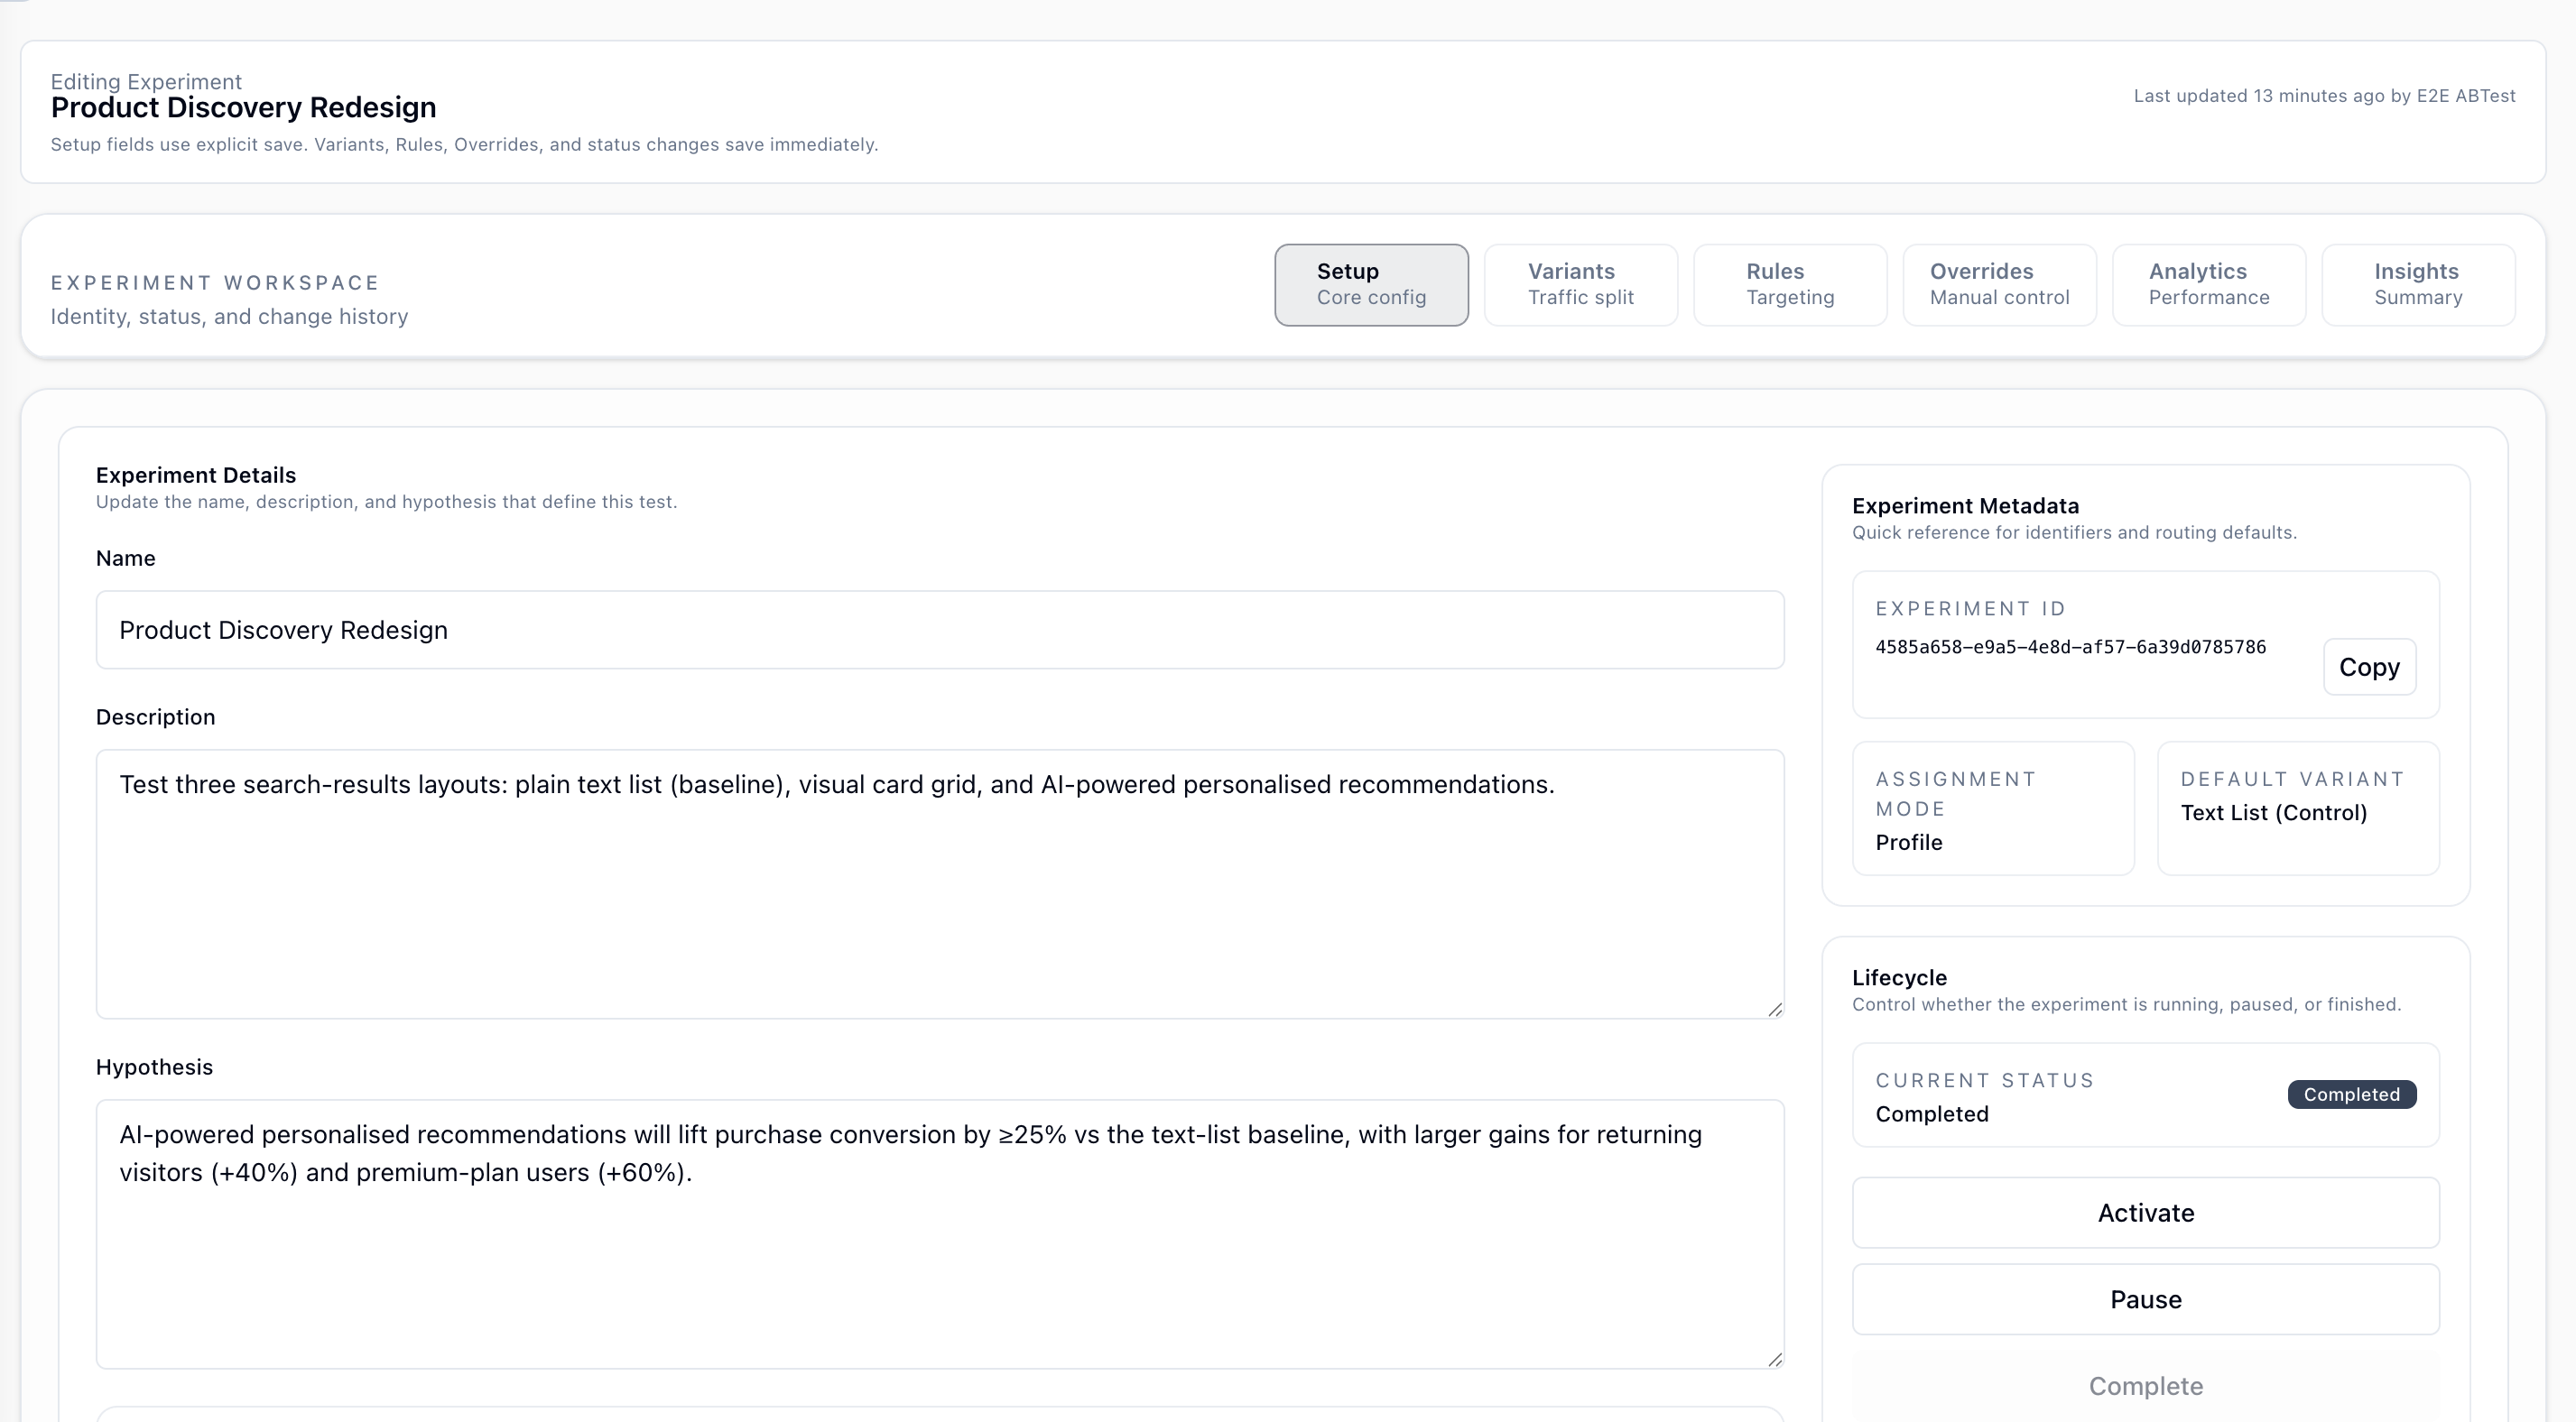
Experiment Details
| Field | Description |
|---|---|
| Name | The display name used in the dashboard and in the AI insight summary. |
| Description | Optional. Describes what the experiment changes and what users will see. |
| Hypothesis | Optional. State the expected outcome and why a variant should outperform the baseline. Included verbatim in AI insights for context. |
Changes to these fields are not saved automatically. Click Save Setup on the right when ready.
Experiment Metadata
| Field | Description |
|---|---|
| Experiment ID | The UUID used in API calls (POST /experiments/assign) and in Track events (__experimentId). |
| Assignment Mode | Set at creation time and read-only thereafter. |
| Default Variant | The variant served when the experiment is inactive, or when no rule or allocation matches. |
Lifecycle
| Action | What it does |
|---|---|
| Activate | Sets status to active. The assignment endpoint starts serving real variants. |
| Pause | Stops variant assignment. All traffic falls through to the default variant. |
| Complete | Marks the experiment as finished and can be used to archive after analysis. |
Caveat: The assignment endpoint always returns a variant even when the experiment is inactive. It returns thedefaultVariantIdwith reasonexperiment_inactiveso your integration stays stable.
Conversion Config
This section defines which events are measured in the Analytics tab.
Primary Metric
The final event that counts as a successful conversion, for example purchase, checkout_complete, or signup.
- Pick an event by name from the selector.
- Use + Add Filter to narrow conversion to a specific property value.
- Filters support
is,isNot,contains,doesNotContain,startsWith,endsWith,gt,gte,lt,lte,isNull, andisNotNull.
Caveat: Filters apply in ClickHouse at query time. If you add a filter after the experiment is already running, historical data is re-filtered immediately on the next analytics query.
Secondary Event
An earlier event that marks the beginning of the conversion funnel, for example add_to_cart before purchase.
- Use the Enabled or Disabled toggle to show or hide this field.
- When set, the Conversion Flow chart shows
secondaryEvent -> primaryMetric. - When not set, conversion is measured as
exposure -> primaryMetric. - Supports the same filter configuration as Primary Metric.
Caveat: Only subjects who fired the secondaryEvent are counted as potential converters in two-step mode. A subject who goes directly to the primary metric is counted as an exposure, but not as a starter or conversion.Tracked Events
Add up to five events you want to watch for behavioral trends without making them part of the conversion funnel.
- Click Add tracked event to pick an event.
- Each tracked event supports its own filter conditions.
- You can configure up to five tracked events per experiment.
- Removing one removes its chart from the Analytics tab after the next save.
Caveat: Tracked events are separate from the conversion flow. A tracked event and your primaryMetric can use the same event name and will still be queried independently.Change History
At the bottom of the Setup tab, a chronological log shows who changed what and which value changed from or to.
3. Variants Tab - Traffic Split
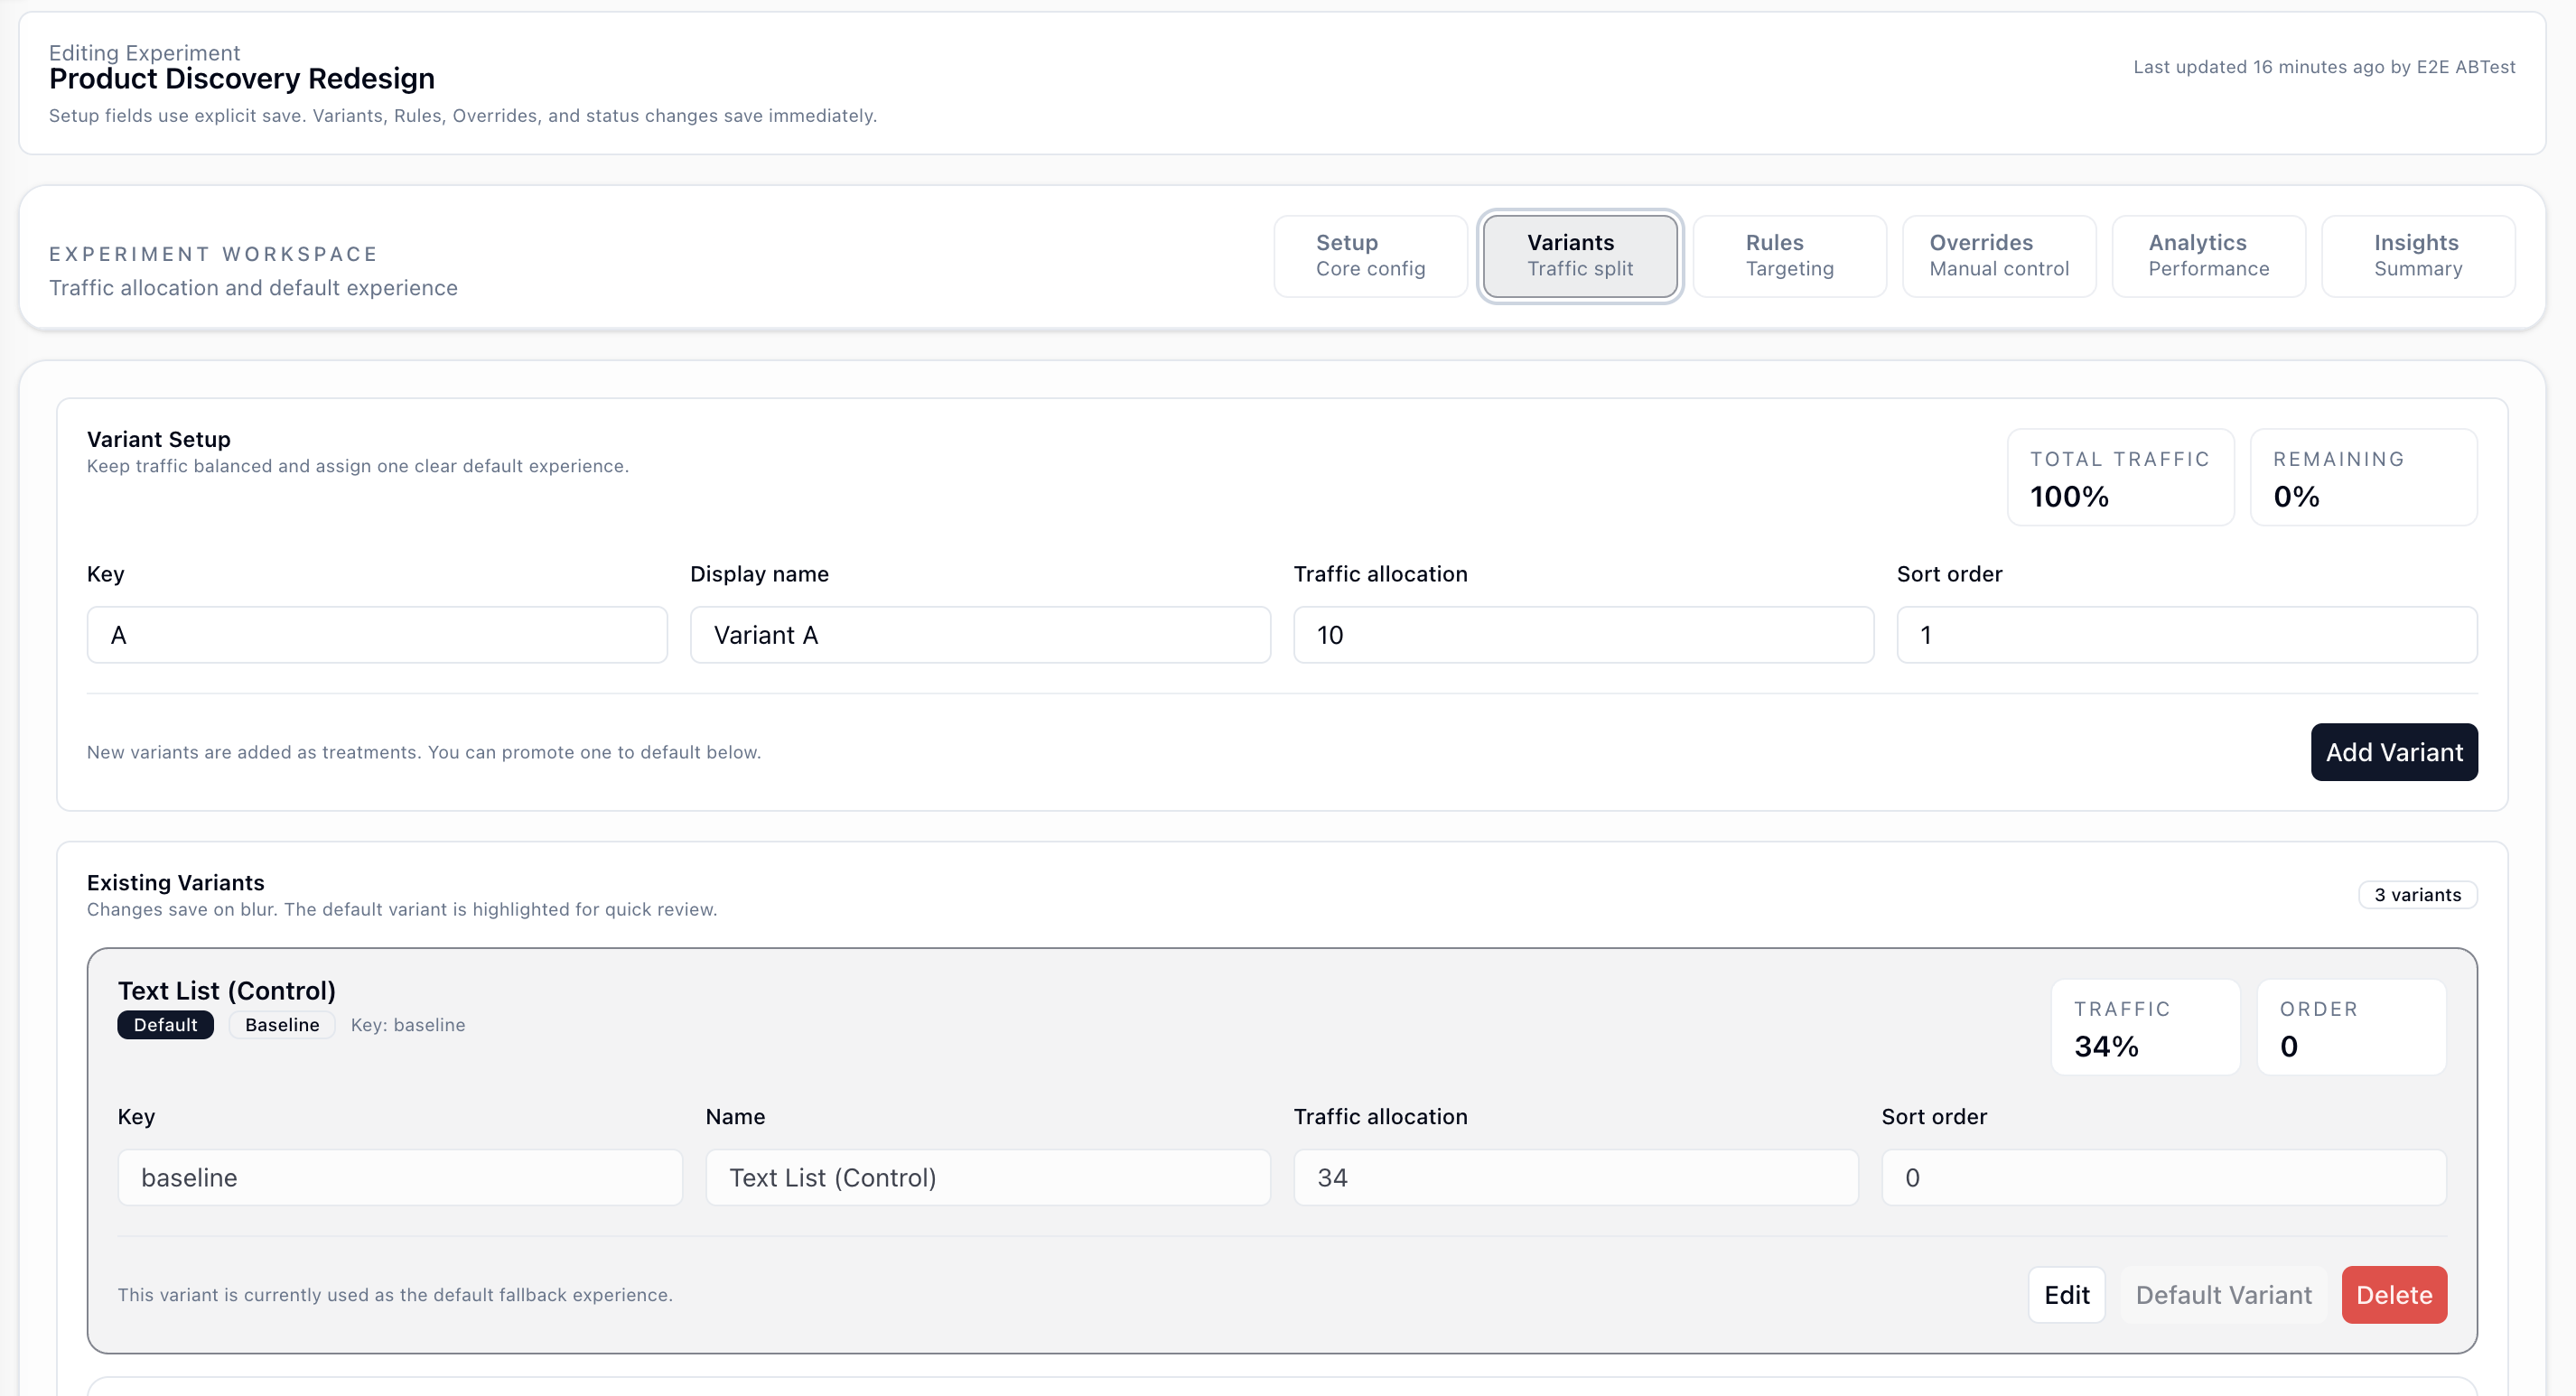
Adding a Variant
| Field | Description |
|---|---|
| Key | Short identifier used in code and analytics (__variantId), such as A, B, or control. No spaces allowed. |
| Display Name | Human-readable label shown in dashboards and AI summaries. |
| Traffic Allocation | The percentage of the random-eligible pool that should receive this variant. |
| Sort Order | Controls tie-breaking when two rules have equal priority. Lower index wins. |
Click Add Variant to save. New variants are added as treatment variants.
Existing Variants
| Action | Description |
|---|---|
| Edit | Modify key, name, traffic, or order. Saves on blur. |
| Set As Default | Promotes this variant to defaultVariantId. All unmatched traffic falls through here, and it is also served when the experiment is inactive. |
| Delete | Permanently removes the variant. This cannot be undone if the experiment has live traffic. |
Caveat: Traffic percentages apply only to the random-eligible pool. Overrides and rules can capture subjects before random allocation, so observed percentages can differ from configured percentages.
Caveat: Traffic percentages do not need to sum to 100 percent. Any remainder is unallocated and those subjects receive the default variant.
4. Rules Tab - Targeting
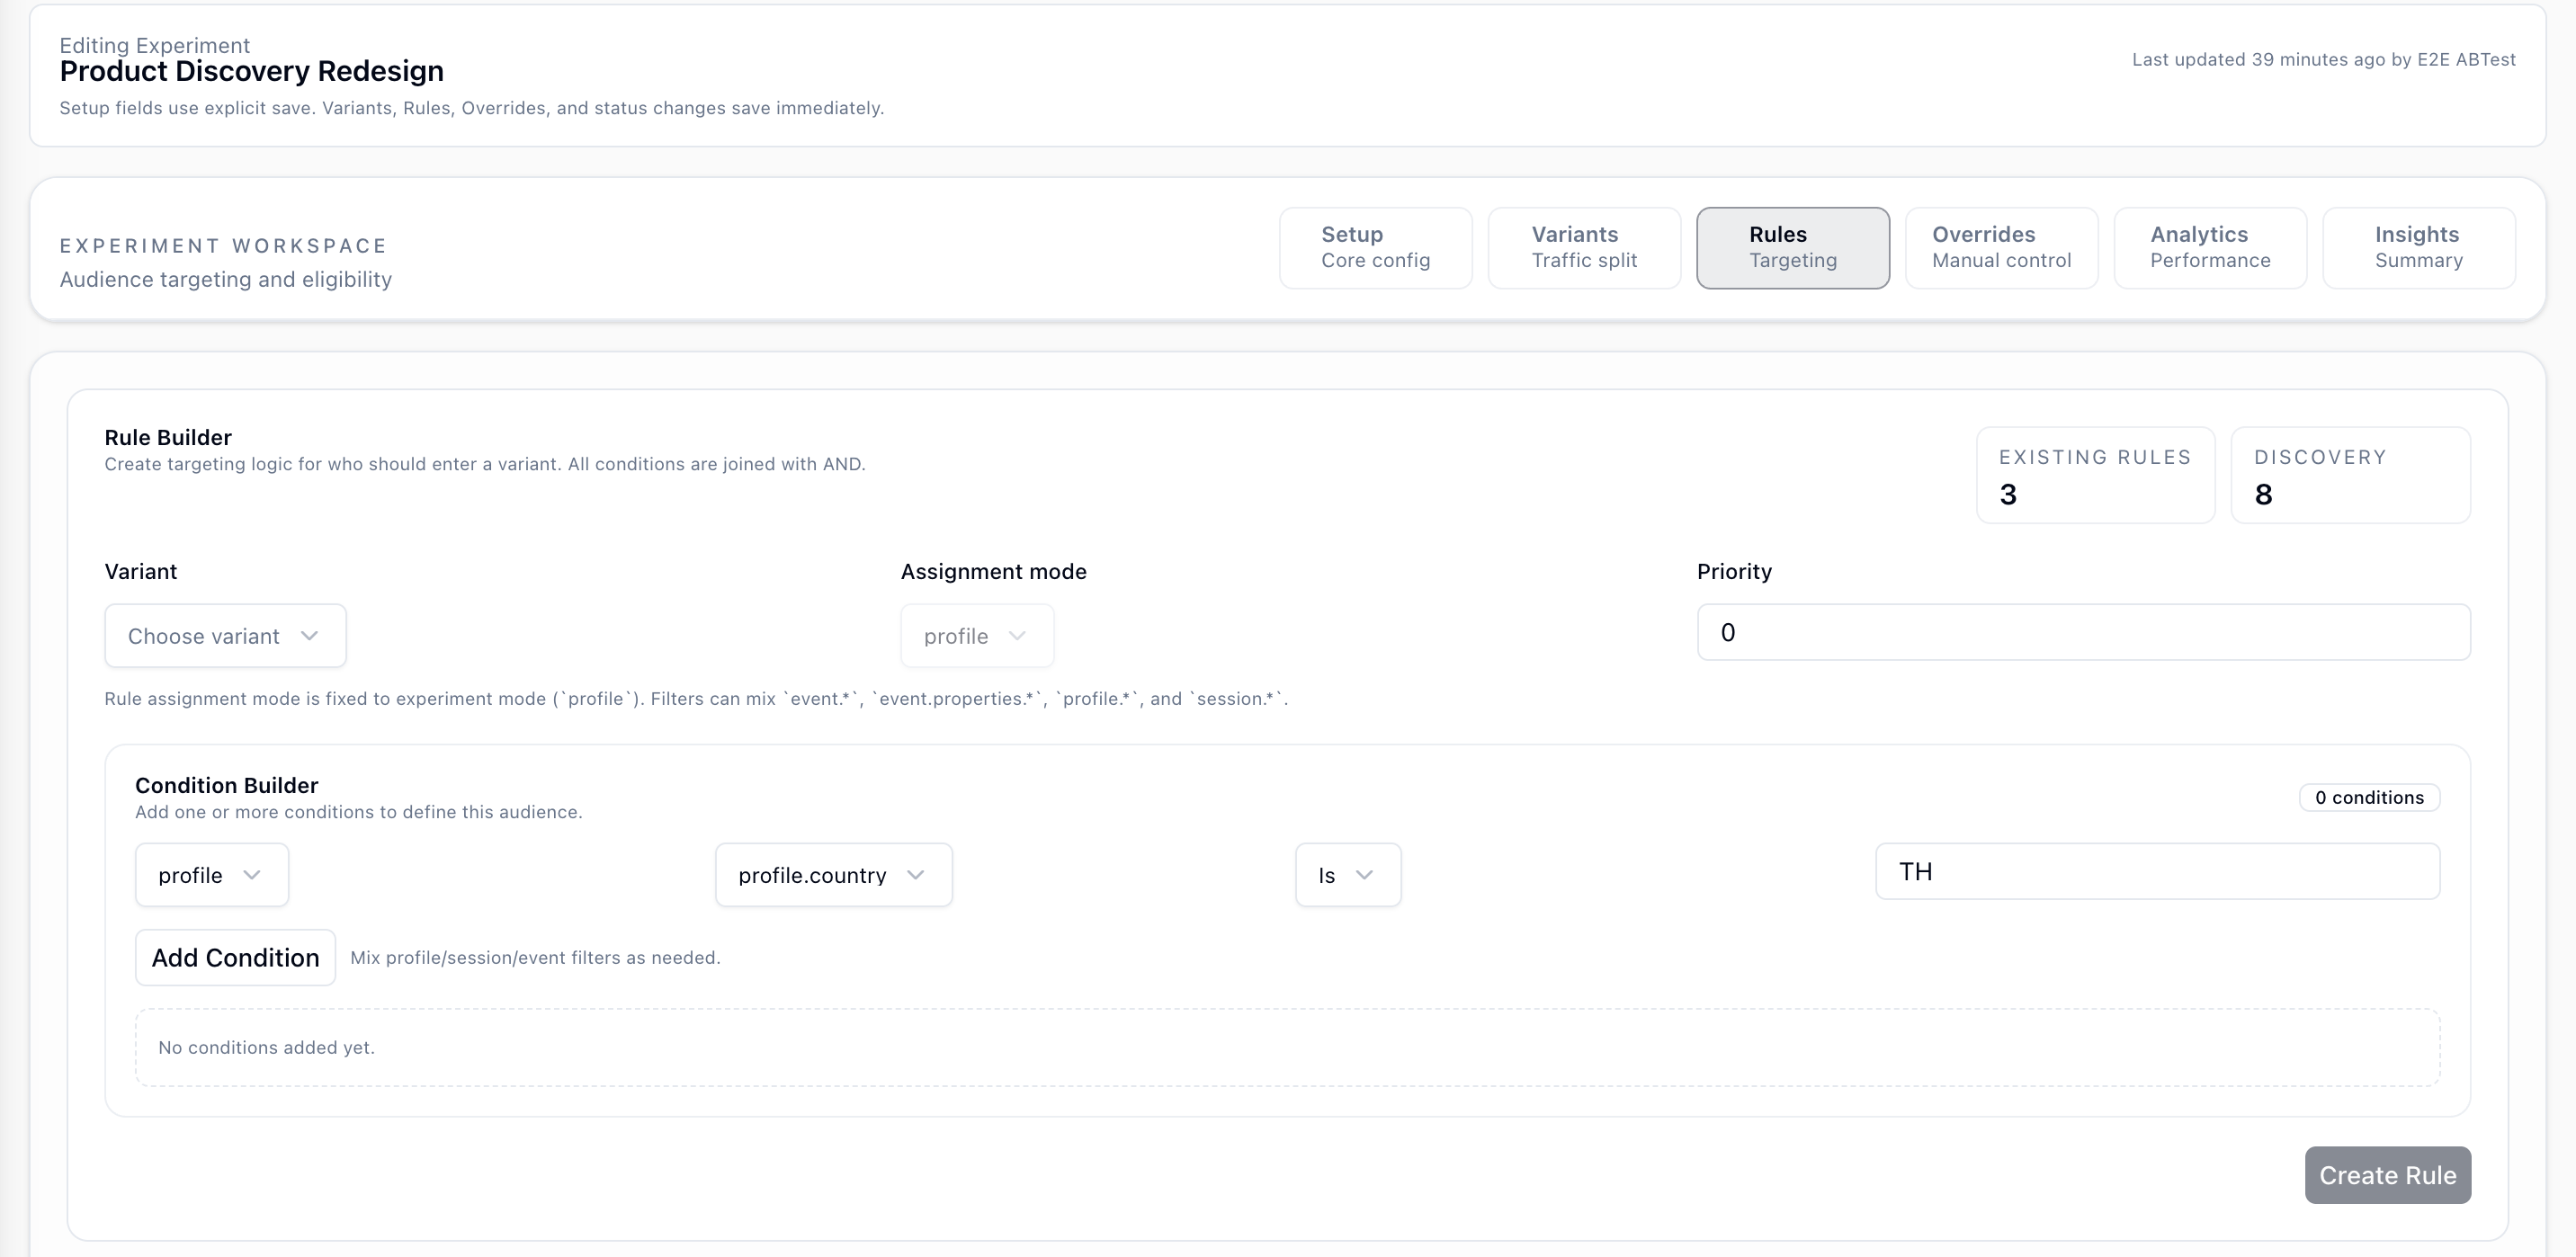
Rules deterministically route specific subjects into a variant based on their attributes. Rules run after override checks and before random allocation.
Rule Builder
| Field | Description |
|---|---|
| Variant | The variant this rule routes to when it matches. |
| Assignment Mode | Fixed to the experiment assignment mode and shown for reference. |
| Priority | Higher number wins when multiple rules match the same subject. Tie is broken by variant orderIndex. |
Condition Builder
Add one or more conditions. All conditions within a rule are joined with AND.
Each condition has three parts:
- Scope -
profile,session, orevent - Field - for example
profile.country,event.properties.plan, orsession.entryPage - Operator + Value - for example
is TH,contains grocery, orgt 100
You can mix profile, session, and event fields in the same rule to target more precisely.
Caveat: Field suggestions are sourced from recent events in your project. If a property is new or rare, it may not appear in suggestions yet, but you can still type it manually.
Caveat: Rules are evaluated in priority order. If a subject matches a rule, subsequent rules are not evaluated.
5. Overrides Tab - Manual Control
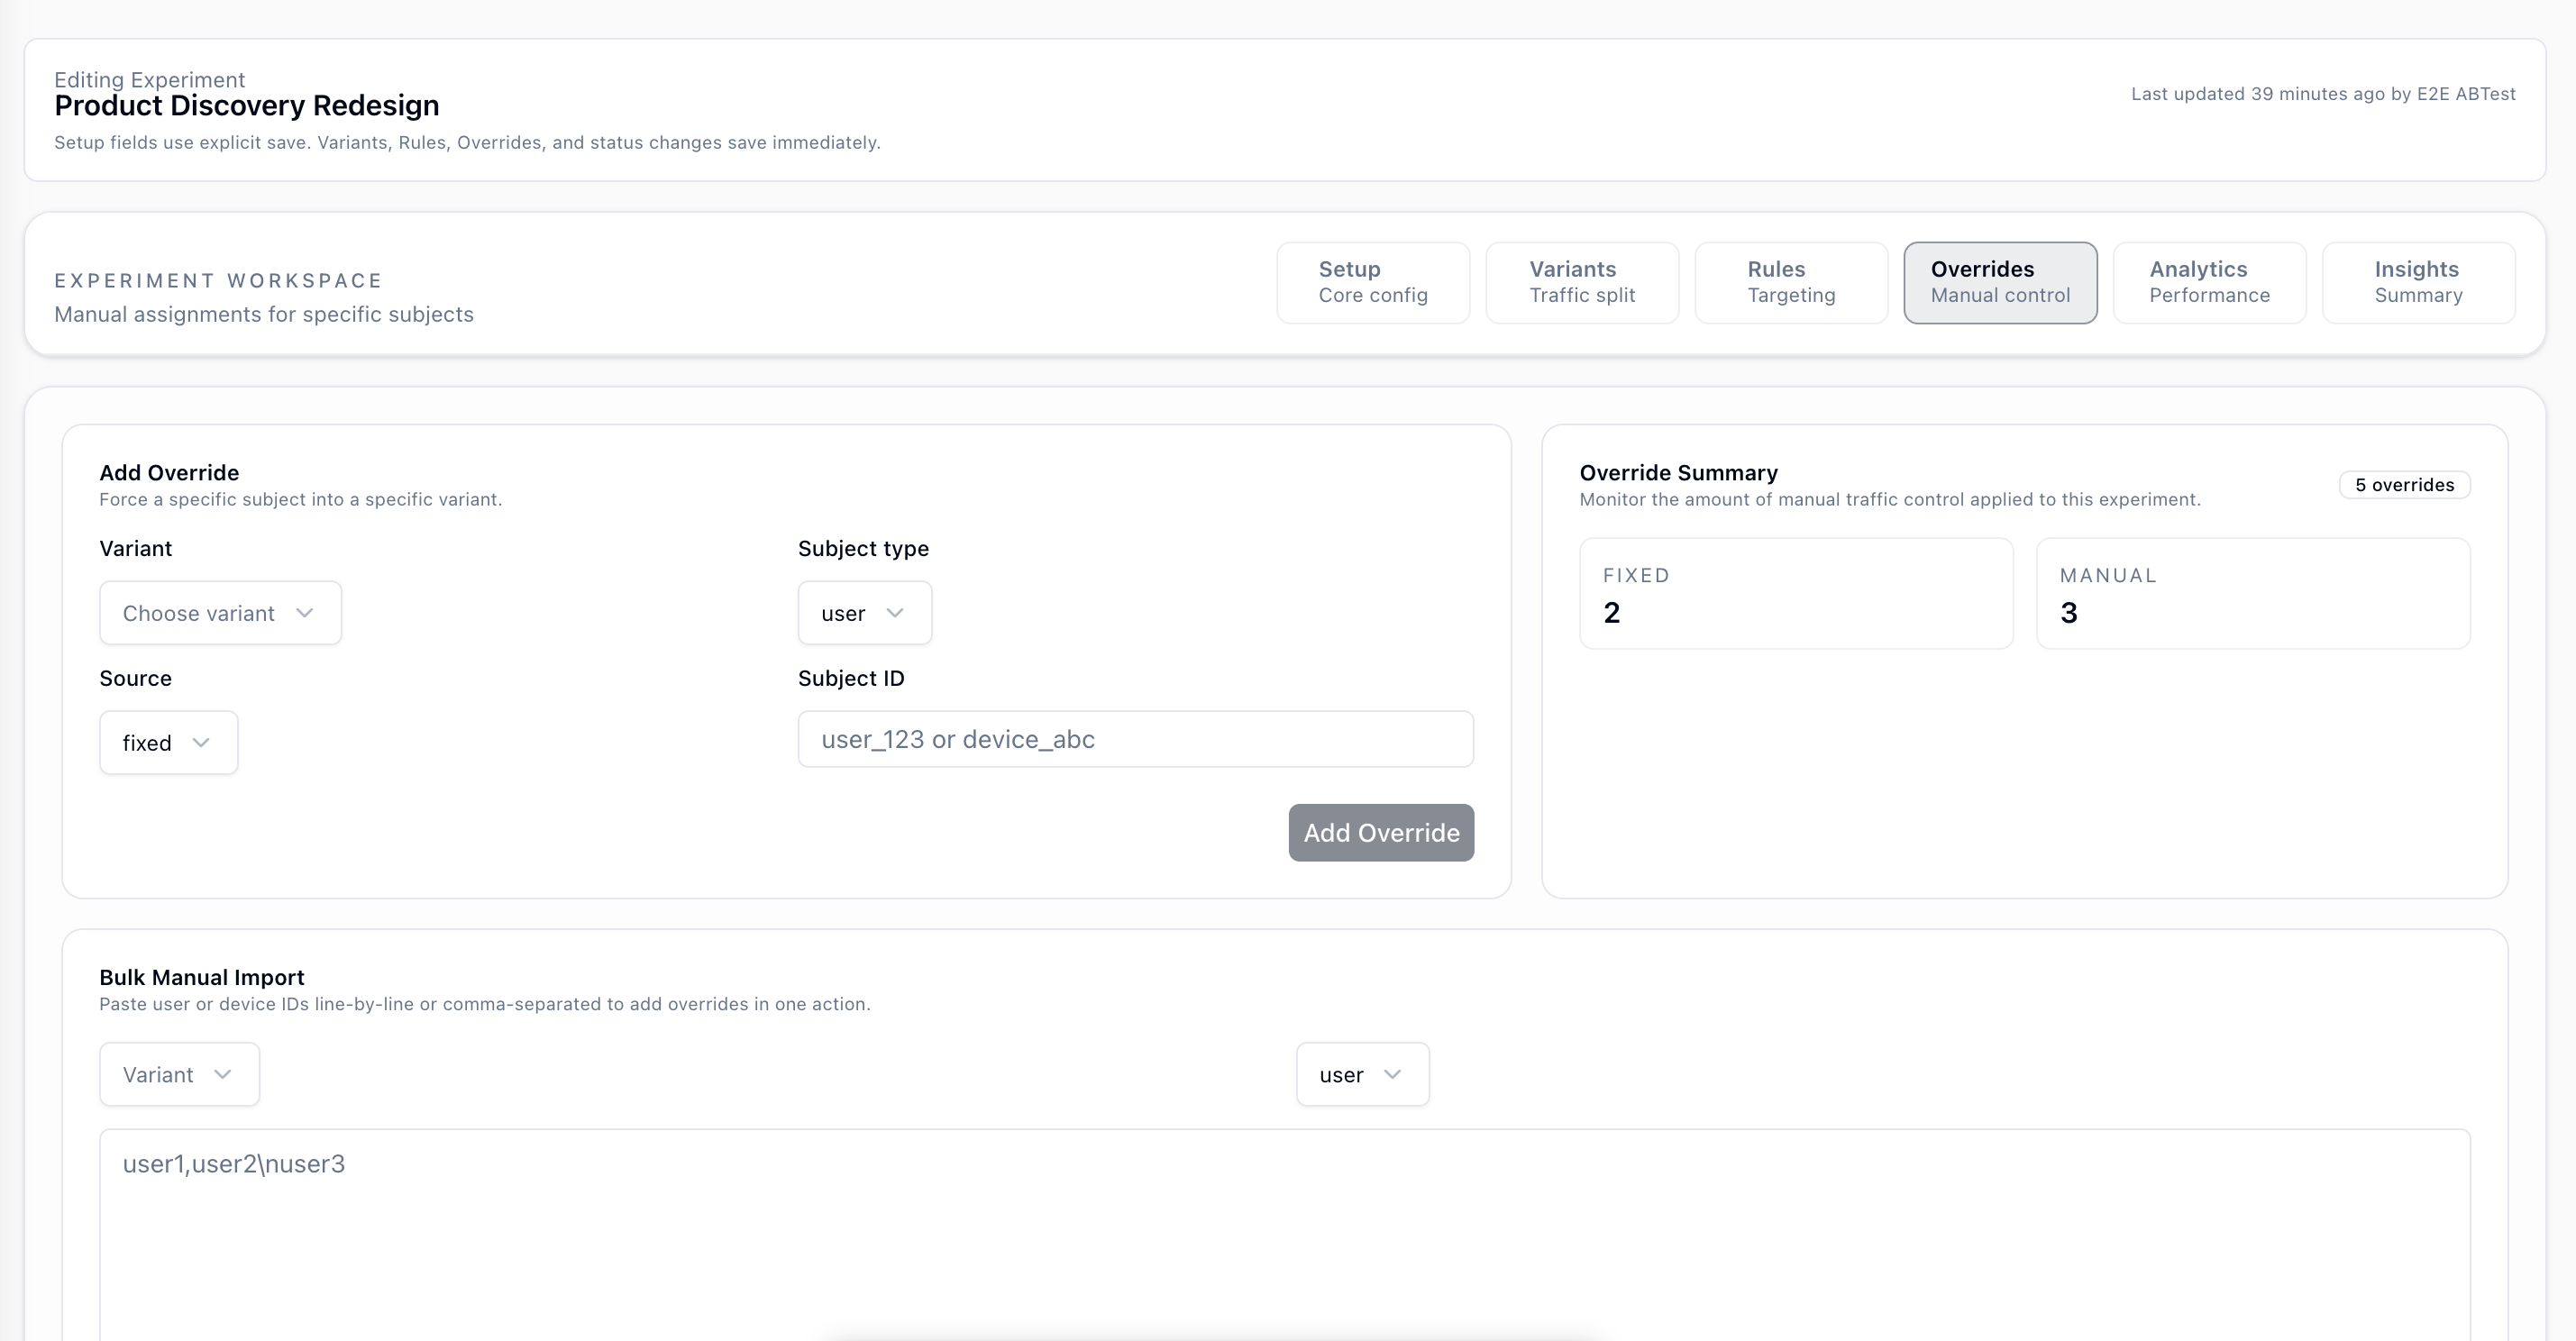
Overrides force a specific subject into a specific variant, regardless of rules or traffic allocation. Overrides always win.
Add Override
| Field | Description |
|---|---|
| Variant | The variant to force. |
| Subject Type | user by userId or device by deviceId. |
| Source | Always fixed for new entries. |
| Subject ID | The actual userId or deviceId string. |
Override Summary
The right panel shows the count of fixed and manual overrides currently applied. Manual overrides are legacy entries imported before normalization, but they behave the same at assignment time.
Bulk Manual Import
Paste a list of user IDs or device IDs, one per line or comma-separated, choose the target variant and subject type, then click Import Manual Overrides.
Caveat: Override lookup happens before rules and allocation. An overridden subject always receives the assigned variant while the experiment is active.
Caveat: There is a uniqueness constraint per (experimentId, subjectType, subjectId). Importing the same ID again updates the existing override.6. Analytics Tab - Performance
All charts read from your event stream in ClickHouse. They filter on __experimentId and group by __variantId. No data is pre-aggregated. Queries run on demand over your raw events.
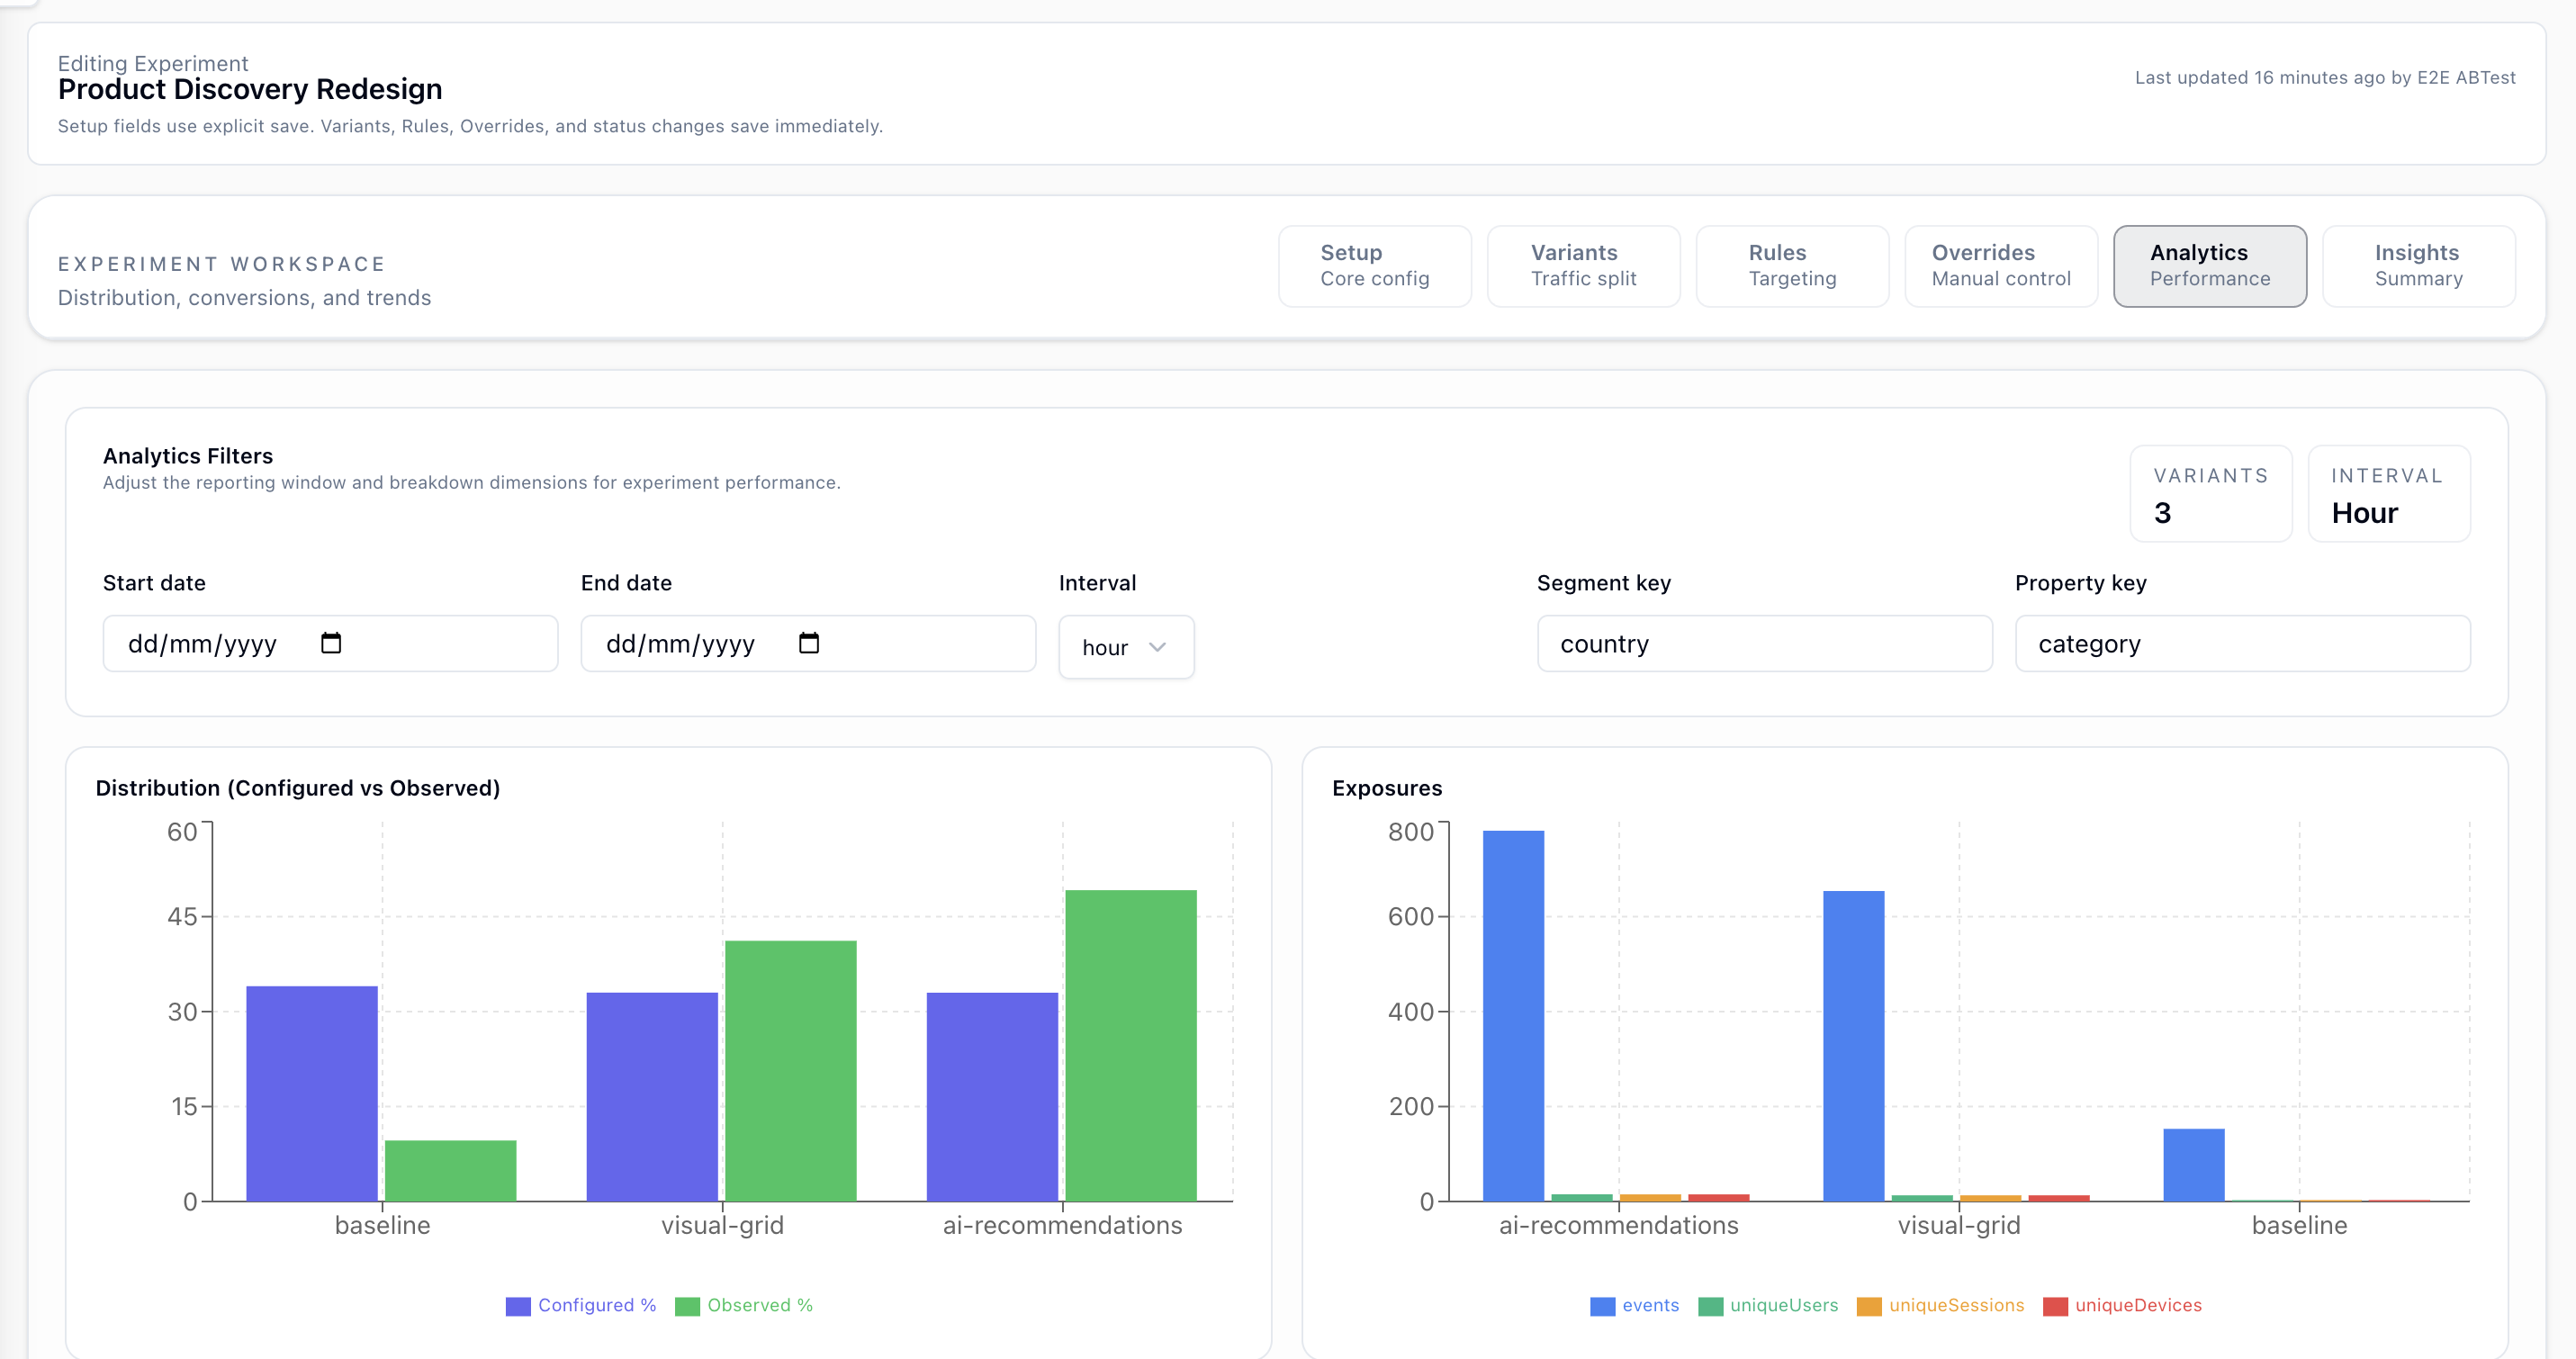
Analytics Filters
| Filter | Description |
|---|---|
| Start / End Date | Narrows the query window. Leave blank to query all time. |
| Interval | Bucket size for time series charts: hour, day, or week. |
| Segment Key | Property to group by in the Segments chart. Defaults to country and also supports system columns and properties.* keys. |
| Property Key | Property to break down in the Property Breakdown chart. Defaults to category. |
Distribution
A bar chart compares configured traffic percentage against observed share per variant. Blue shows configured allocation and green shows observed traffic.
Large gaps usually mean overrides or rules are capturing a significant portion of traffic before random allocation.
Exposures
Event and unique user, session, or device counts per variant depend on assignment mode.
| Mode | Exposure metric |
|---|---|
| profile | Unique profile IDs |
| session | Unique session IDs and unique profile IDs |
| event | Event count, unique profile IDs, and unique device IDs |
Caveat: Exposures are counted from events carrying __experimentId. If your SDK or server is not attaching attribution properties, exposures will be zero even if assignment is working.Conversion Flow
- If no primary metric is set, a placeholder message is shown.
- With only a primary metric, the chart shows exposures to conversions.
- With a secondary event and primary metric, the chart shows exposures to starters to conversions.
Time Series
Time series charts show exposure event counts over time per variant at the selected interval. Use them to spot rollout ramp-up, drops, or novelty effects.
Tracked Events
One line chart is shown per configured tracked event, with one line per variant. If no tracked events are configured, a placeholder is shown instead.
Segments
A table breaks down event counts by the selected Segment Key so you can compare which segment and variant combinations are most active.
Property Breakdown
A table breaks down event counts by the selected Property Key value per variant, which helps surface heterogeneous behavior.
Caveat: Segments and Property Breakdown use all experiment-attributed events, not just conversion events. They show behavioral reach, not conversion performance.
7. Insights Tab - AI Summary
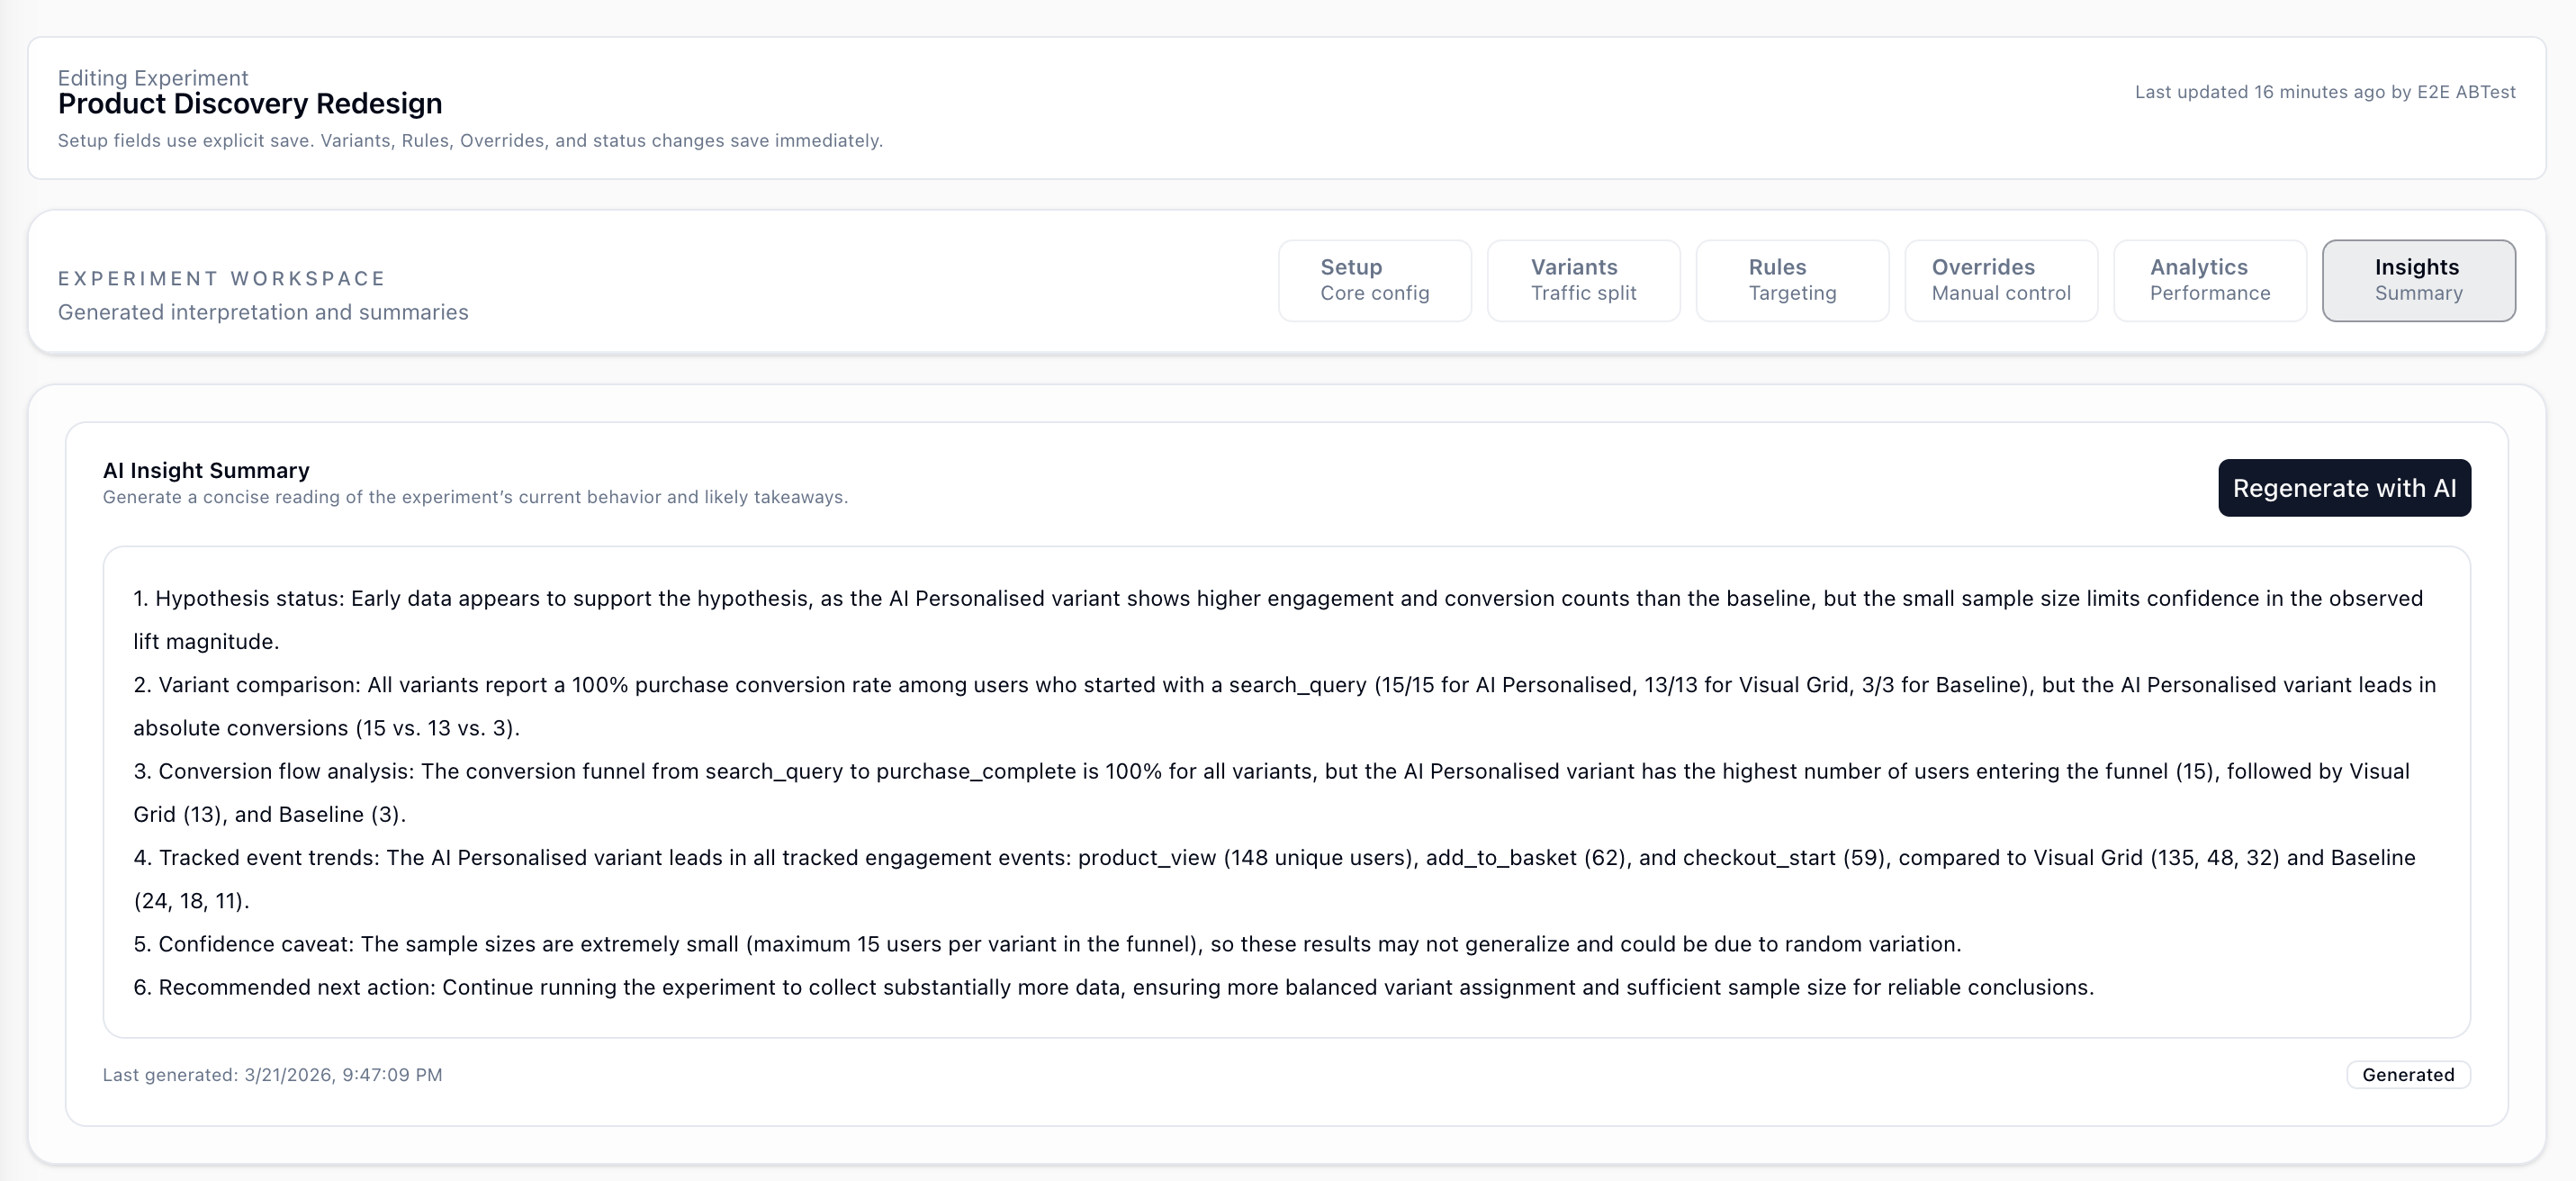
Click Regenerate with AI to generate a descriptive summary of the experiment's current state.
The AI reads:
- Your hypothesis
- Current distribution data, including configured vs observed traffic
- Conversion rates per variant when a primary metric is configured
- Tracked event trends per variant when tracked events are configured
- Exposure time series
It produces a plain-language summary comparing variants against the baseline while referencing the experiment hypothesis for context.
Caveat: The summary is descriptive only. No statistical significance or p-values are computed, so treat it as a structured reading of the data, not a decision engine.
Caveat: The summary is saved to the experiment and does not auto-refresh. Regenerate it whenever you want a fresh read after more data arrives or after config changes.
Caveat: If tracked events are not configured, the AI falls back to analyzing all experiment-attributed events by variant. The quality of that fallback depends on the event coverage in your experiment traffic.
8. SDK Integration
Each Flash Analytics SDK can automatically keep a local in-memory store of experiment assignments in sync. Enable captureVariants once and the SDK handles fetching, refreshing, and expiring assignments at the right lifecycle moments.
Enable auto-capture
Pass captureVariants during SDK initialisation.
TypeScript / WebSDK reference →
import { FlashAnalytics } from '@flash-analytics/web';

const analytics = new FlashAnalytics({
  appId: 'YOUR_APP_ID',
  endpoint: 'https://api.flashanalytics.app',
  captureVariants: true,
  // or with callback:
  // captureVariants: {
  //   onAssignmentsChanged: (assignments) => {
  //     console.log('variants updated', assignments);
  //   },
  // },
});Next.jsSDK reference →
<FlashAnalyticsComponent
  appId={process.env.NEXT_PUBLIC_FLASH_ANALYTICS_APP_ID!}
  endpoint="https://api.flashanalytics.app"
  captureVariants
  // or with callback:
  // captureVariants={{ onAssignmentsChanged: (assignments) => {} }}
/>
Kotlin (Android)SDK reference →
FlashAnalyticsOptions(
    appId = "YOUR_APP_ID",
    endpoint = "https://api.flashanalytics.app",
    captureVariants = CaptureVariantsOptions(
        onAssignmentsChanged = { assignments ->
            // called whenever the local cache changes
        }
    )
)
Swift (iOS)SDK reference →
FlashAnalyticsOptions(
    appId: "YOUR_APP_ID",
    endpoint: "https://api.flashanalytics.app",
    captureVariants: CaptureVariantsOptions(
        onAssignmentsChanged: { assignments in
            // called whenever the local cache changes
        }
    )
)
Reading assignments
All reads are synchronous and served from the local store — no API call is made unless the requested experiment is not in the cache.
TypeScript / Web / Next.jsSDK reference →
// All cached assignments — no API call
const all = analytics.getAllExperiments();

// Single experiment — cache first, falls back to API on a cache miss
const assignment = await analytics.getExperimentById('checkout-cta');
console.log(assignment?.variantName);
Kotlin (Android)SDK reference →
// All cached assignments — no API call
val all = analytics.getAllExperiments()

// Single experiment — suspend, cache first, API fallback on cache miss
val assignment = analytics.getExperimentById("checkout-cta")
println(assignment?.variantName)

// Callback wrapper for non-coroutine code
analytics.getExperimentByIdAsync("checkout-cta") { assignment ->
    println(assignment?.variantName)
}
Swift (iOS)SDK reference →
// All cached assignments — no API call
let all = analytics.getAllExperiments()

// Single experiment — async, cache first, API fallback on cache miss
let assignment = await analytics.getExperimentById(experimentId: "checkout-cta")
print(assignment?.variantName ?? "none")

// Callback wrapper
analytics.getExperimentById(experimentId: "checkout-cta") { assignment in
    print(assignment?.variantName ?? "none")
}
Manual assignment
Use manual calls when you want to trigger assignment at a specific moment rather than waiting for the automatic lifecycle fetch.
// Assign a single experiment — always calls the API
const variant = await analytics.assignExperiment('checkout-cta');

// Resolve all eligible experiments at once — always calls the API
const assignments = await analytics.autoAssignExperiments();
Cache lifecycle
The local store is updated automatically at three lifecycle moments. Understanding when each update fires helps you reason about what getAllExperiments() will return at any point.
| Moment | Profile assignments | Session assignments | Event assignments |
|---|---|---|---|
| First track() — new session | Fetched | Fetched | Fetched |
| identify() | Re-fetched | Unchanged | Unchanged |
| Session expiry | Unchanged | Removed | Unchanged |
| Next track() — new session after expiry | Re-fetched | Re-fetched | Re-fetched |
| Subsequent track() — same session | Unchanged | Unchanged | Unchanged |
9. Caveats and Gotchas
Assignment is stateless
There is no assignment history table. Variant assignment is recomputed on each request, or served from a short-lived Redis cache.
- You cannot query all users in Variant A from the database.
- Exposure data comes from Track API events carrying attribution properties.
- If attribution stops being attached, exposure data is lost for that window.
Attribution properties are required for analytics
Your server or SDK must attach attribution properties to every tracked event during the experiment.
{
  "__experimentId": "<id>",
  "__variantId": "<variantKey>",
  "__experimentName": "<name>",
  "__variantName": "<variantName>"
}
The assignment endpoint returns an attribution object in its response. Use it to populate these properties.
Conversion counts subjects, not events
The Conversion Flow chart counts unique subjects who fired the relevant events, not raw event counts. A subject who fires purchase three times still counts as one conversion.
Filters on primaryMetric and secondaryEvent apply retroactively
If you change a filter after the experiment is already running, the next analytics query applies the new filter to all historical data. There is no snapshot of the old filter configuration.
The experiment must be active to serve real variants
While the experiment is in draft or paused status, the /experiments/assign endpoint returns the default variant for all subjects with reason experiment_inactive.
Override import is idempotent per subject ID
Re-importing the same subject ID with a different variant updates the existing override. Re-importing it with the same variant is a no-op.