Funnels and conversions
How we calculate funnel steps and conversion rates, including optimized entry and hold-constant.
This page explains how Flash Analytics computes funnels and conversions, including:
- default vs optimized (reoptimized) entry
- conversion windows
- grouping by session or profile
- hold property constant (e.g., properties.query)
- breakdown behavior
Funnel steps and grouping
A funnel is an ordered sequence of events, for example:
Product viewed -> Added to cart -> Checkout completedWe evaluate funnels per group:
- Session:
session_id - Profile:
profile_id
All logic below is the same; only the group key changes.
Totals vs unique
Funnels can be counted in two ways:
- Unique (distinct): each group is counted once. Examples:
session_idfunnels count each session once.profile_idfunnels count each profile once.
- Totals (event): each qualifying entry event is counted as a separate attempt, even if it belongs to the same profile/session.
Use Unique when you want how many sessions/profiles converted. Use Totals when you want how many attempts converted.
Conversion window
The conversion window is the maximum allowed time from entry (step A) to the final step.
Example (24h window):
- A at T0
- B and C must occur between T0 and T0 + 24h
We do not reset this window when later steps occur.
Entry modes
Default entry
Default entry anchors the attempt to the first Step 1 (A) for that group in the report range (or per day bucket in conversion charts).
Steps B and C must occur after that entry and within the conversion window.
Optimized (reoptimized) entry
Optimized entry picks the best Step 1 (A) for each group in the report range:
- If a full chain A -> B -> C exists, choose the latest A that completes the chain.
- If no full chain exists, fall back to the earliest A (default behavior).
After selecting the optimized entry, we recompute the steps from that chosen entry time.
Hold property constant
When enabled, all steps must share the same property value captured from the entry event.
Example: hold constant on properties.query
- Step A has query = kiwi
- Step B must also have query = kiwi
- Step C must also have query = kiwi
Missing values are normalized to "__NULL__" so comparisons remain consistent.
Breakdowns
Breakdowns (e.g., country, device, properties.query) are computed from the entry event.
In optimized entry, the breakdown value comes from the optimized entry event, not the earliest event.
Funnel vs conversion charts
Funnel chart
- Returns step counts (level 1, 2, 3, ...)
- No time-series buckets
- Output answers: how many attempts reached each step?
Conversion chart
- Returns time-series conversion rates
- Groups entries by time bucket (day/week/month)
- Output answers: how many attempts converted per bucket?
Example dataset
This example dataset includes the following:
- 3 profiles (P1, P2, P3)
- 4 sessions (S1, S2, S3, S4)
- Funnel: Product viewed -> Added to cart -> Checkout completed
Key scenarios:
- P1/S1: product = apple converts, later product = banana fails
- P1/S4: product = apple fails (A->B only)
- P2/S2: product = orange fails, later product = grape converts
- P3/S3: product = kiwi A/B then product = apple C (mismatch), later product = mango converts
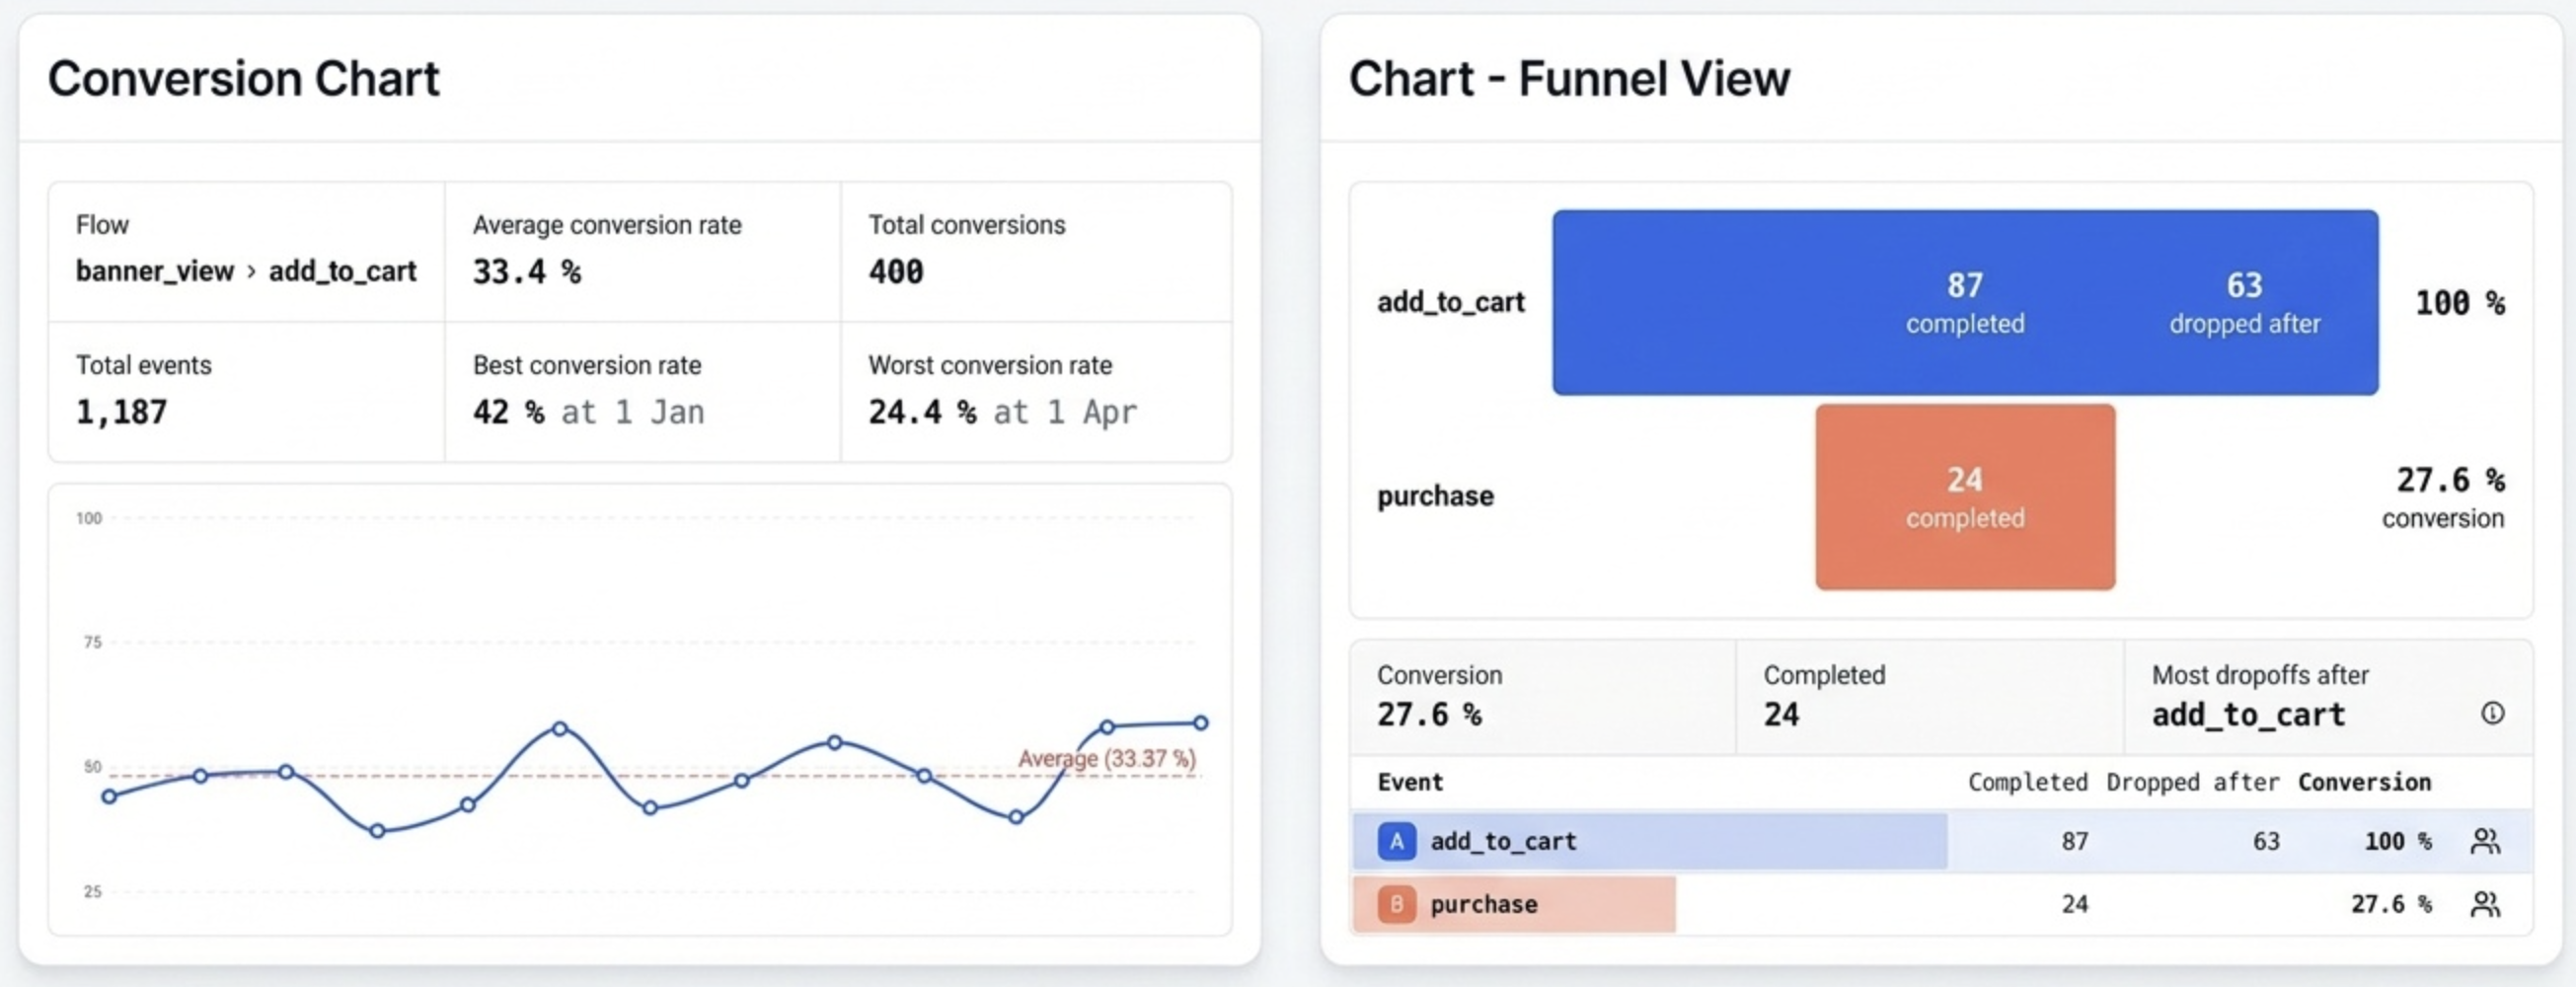
Example visualization
Expected results (no hold-constant)
Session grouping:
- default entry: 2/4 (50%)
- optimized entry: 3/4 (75%)
Profile grouping:
- default entry: 2/3 (66.67%)
- optimized entry: 3/3 (100%)
Expected results (hold properties.query)
Session grouping:
- default entry: 1/4 (25%)
- optimized entry: 3/4 (75%)
Profile grouping:
- default entry: 1/3 (33.33%)
- optimized entry: 3/3 (100%)
Notes
- Session boundaries are defined by
session_idcreation (30-minute inactivity timeout). - Optimized entry can increase conversions by anchoring to the best entry event.
- Hold property constant is useful for intent-specific funnels (search query, product ID, campaign ID).