Power BI Connector - User Guide
Seamlessly import your Flash Analytics event stream, sessions, and aggregated metrics into Microsoft Power BI to create deep, customized visual reports.
The Flash Analytics Power BI Connector provides a secure, direct OData v4 feed to your project data. You can ingest raw events, session data, and daily metrics into Power BI Desktop, build custom visual reports, and securely embed those dashboards back into the Flash Analytics interface.
Table of Contents
- Prerequisites
- Authentication Setup
- Connecting Power BI Desktop
- Available Datasets
- Creating Sample Reports
- Publishing and Scheduled Refresh
- Embedding Dashboards
- Troubleshooting and Best Practices
1. Prerequisites
Before connecting, ensure you have the following:
- A Flash Analytics project with BI enabled.
- Microsoft Power BI Desktop installed on your local machine.
- A Microsoft Work or School account (Entra ID) with Power BI Service access to publish reports.
2. Authentication Setup
Power BI requires strict authentication to access your OData feed. You must create a dedicated API client by following the steps below:
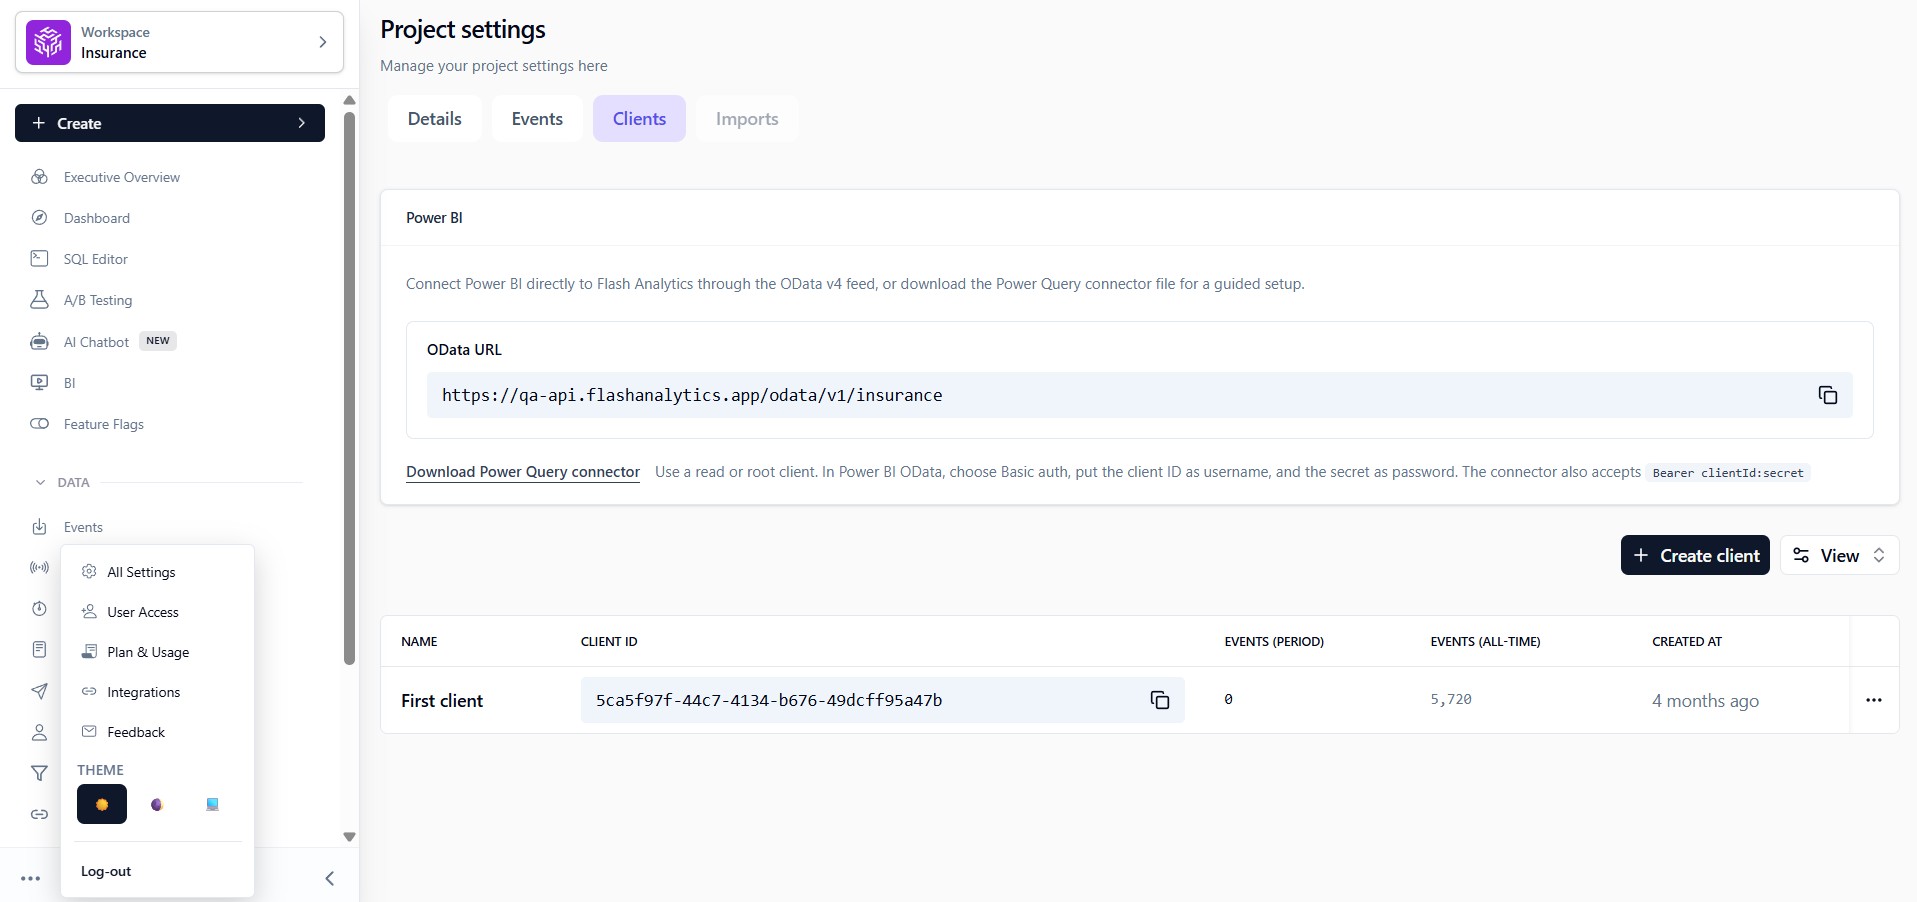
Navigate to the bottom-left corner, click the three dots, and select All Settings. Go to the Clients tab, copy your project's OData URL, and save it securely.
- Navigate to the bottom-left corner, click the three dots, and select All Settings. Go to the Clients tab, copy your project's OData URL, and save it securely.
- Click Create Client, provide a recognizable name, and ensure the client scope is set to read. Click Create.
- Copy the newly generated
client_idandclient_secret. Store these credentials securely, as you will need them to authenticate Power BI.
Caveat: Awriteclient will be explicitly rejected by the OData endpoint with an Unauthorized error. You must use areadclient to export data.
3. Connecting Power BI Desktop
To ingest data into Power BI, locate your project URL and establish a basic authentication connection.
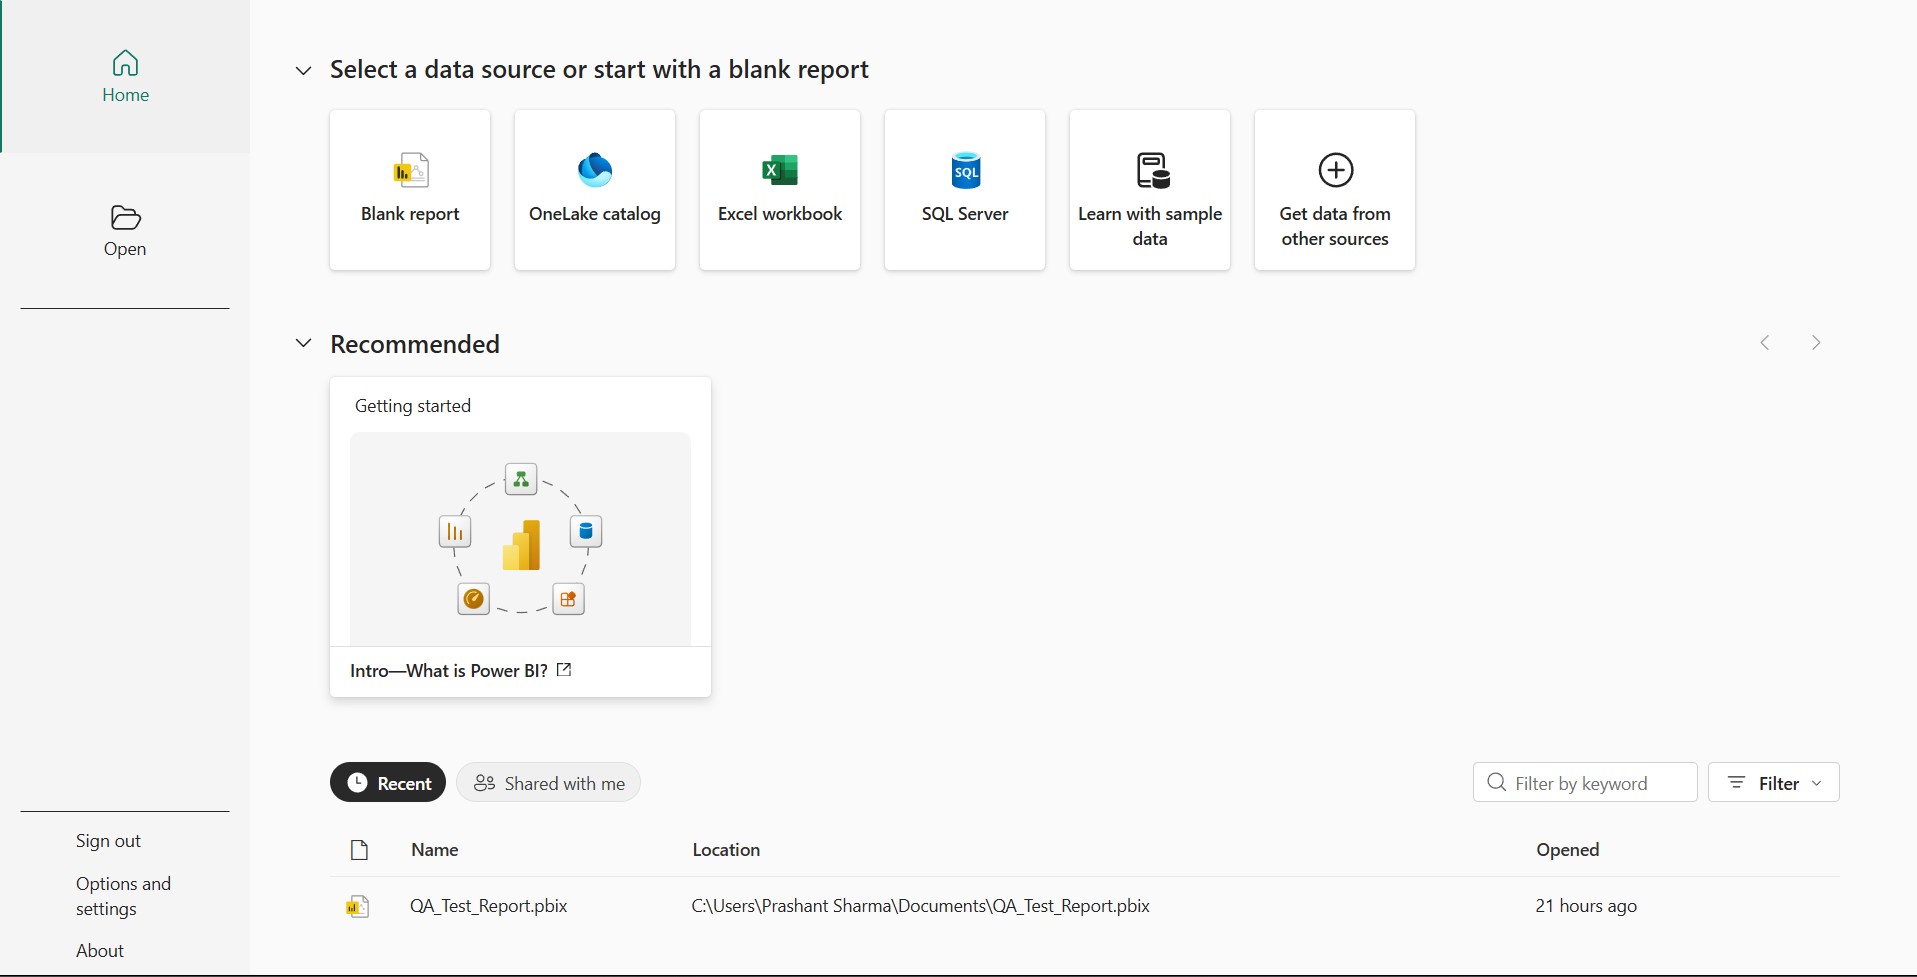
Open Power BI Desktop and click "Get data from another source" on the startup screen.
- Open Power BI Desktop and click Get data from another source on the startup screen.
- In the Get Data window, select Other from the left sidebar, then choose OData Feed.
- Paste the Flash Analytics OData URL you copied earlier into the URL field and click OK.
- Select Basic authentication from the left sidebar. Enter your Client ID as the username and Client Secret as the password.
- In the Navigator window, check the boxes for Events, Metrics, and Sessions, then click Load.
4. Available Datasets
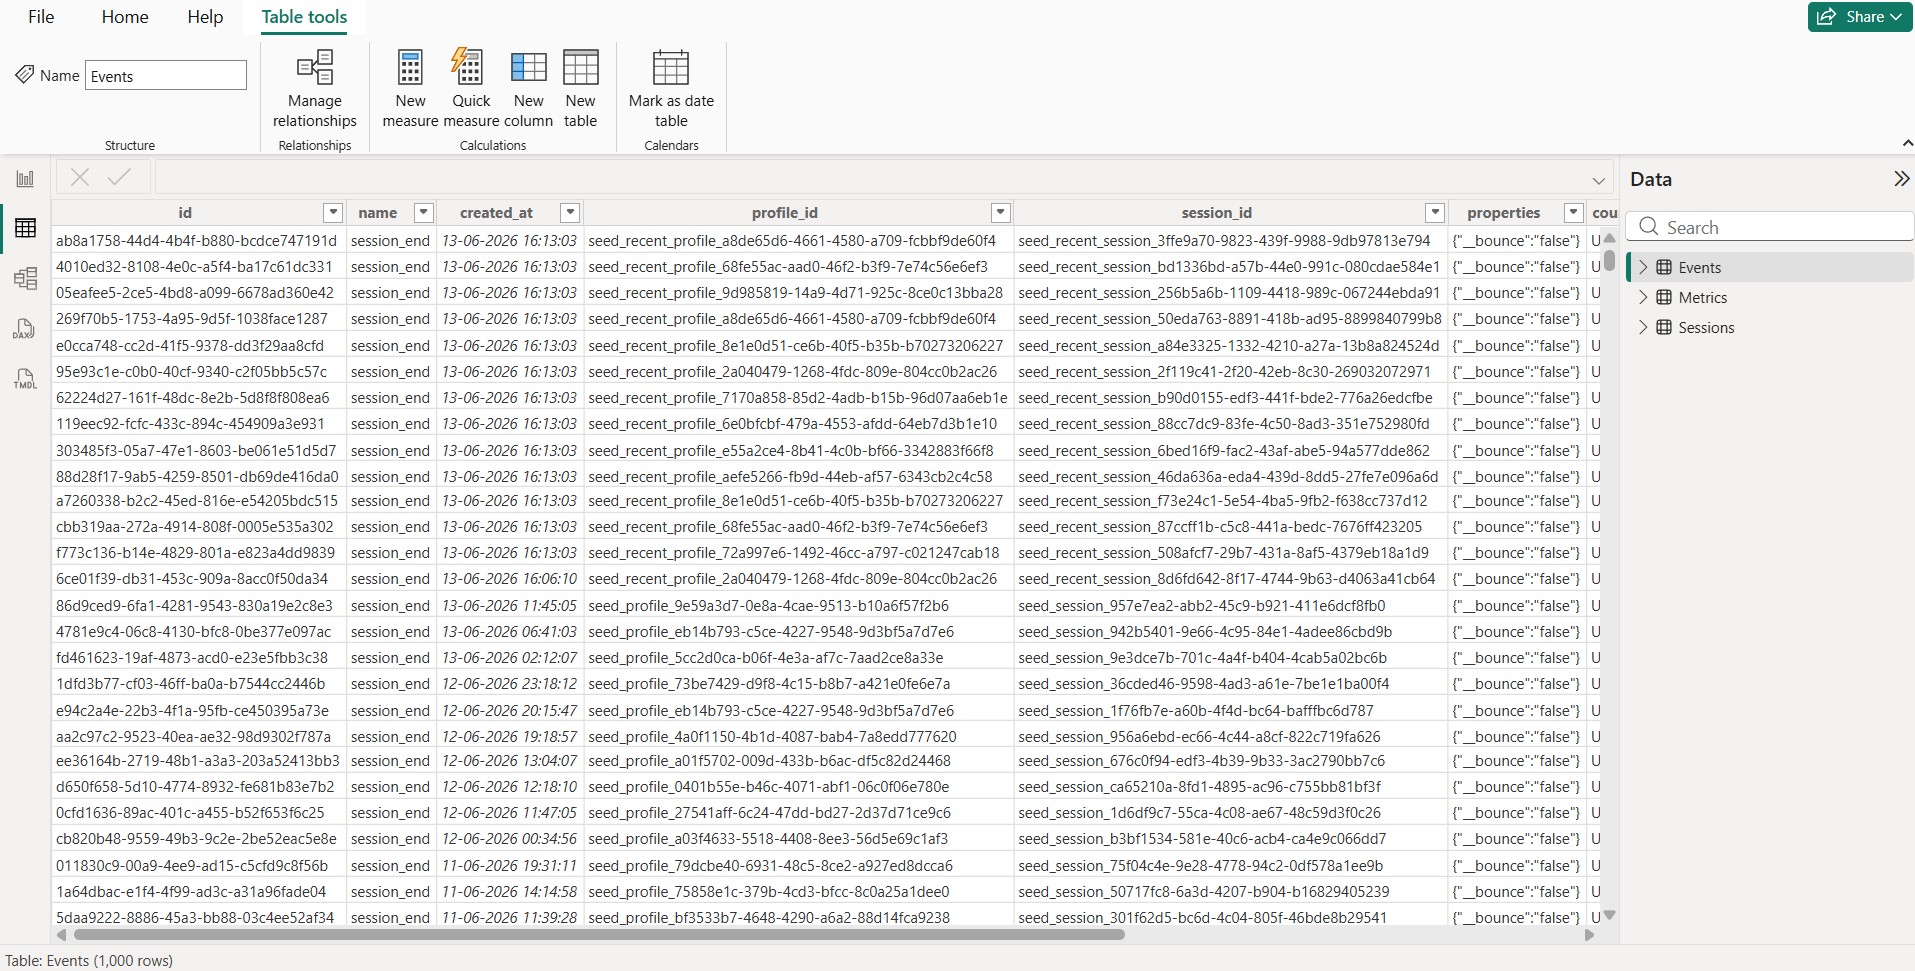
Switch to the Table View from the left sidebar to inspect your imported tables and verify the records.
Once the data is successfully loaded, navigate to the Table View (the table icon on the left sidebar) to explore the imported records. The dataset consists of three core entities:
| Entity | Description |
|---|---|
| Events | Raw stream of user actions. Contains id, event_name, created_at, and properties (stringified JSON). |
| Sessions | Aggregated user sessions detailing duration, entry page, and bounce status. May be empty if worker sweeps have not finalized recent activity. |
| Metrics | Pre-calculated daily aggregates including daily_revenue, total_events, unique_profiles, and sessions. |
5. Creating Sample Reports
Data loaded into Power BI requires mapping to visual axes to render properly.
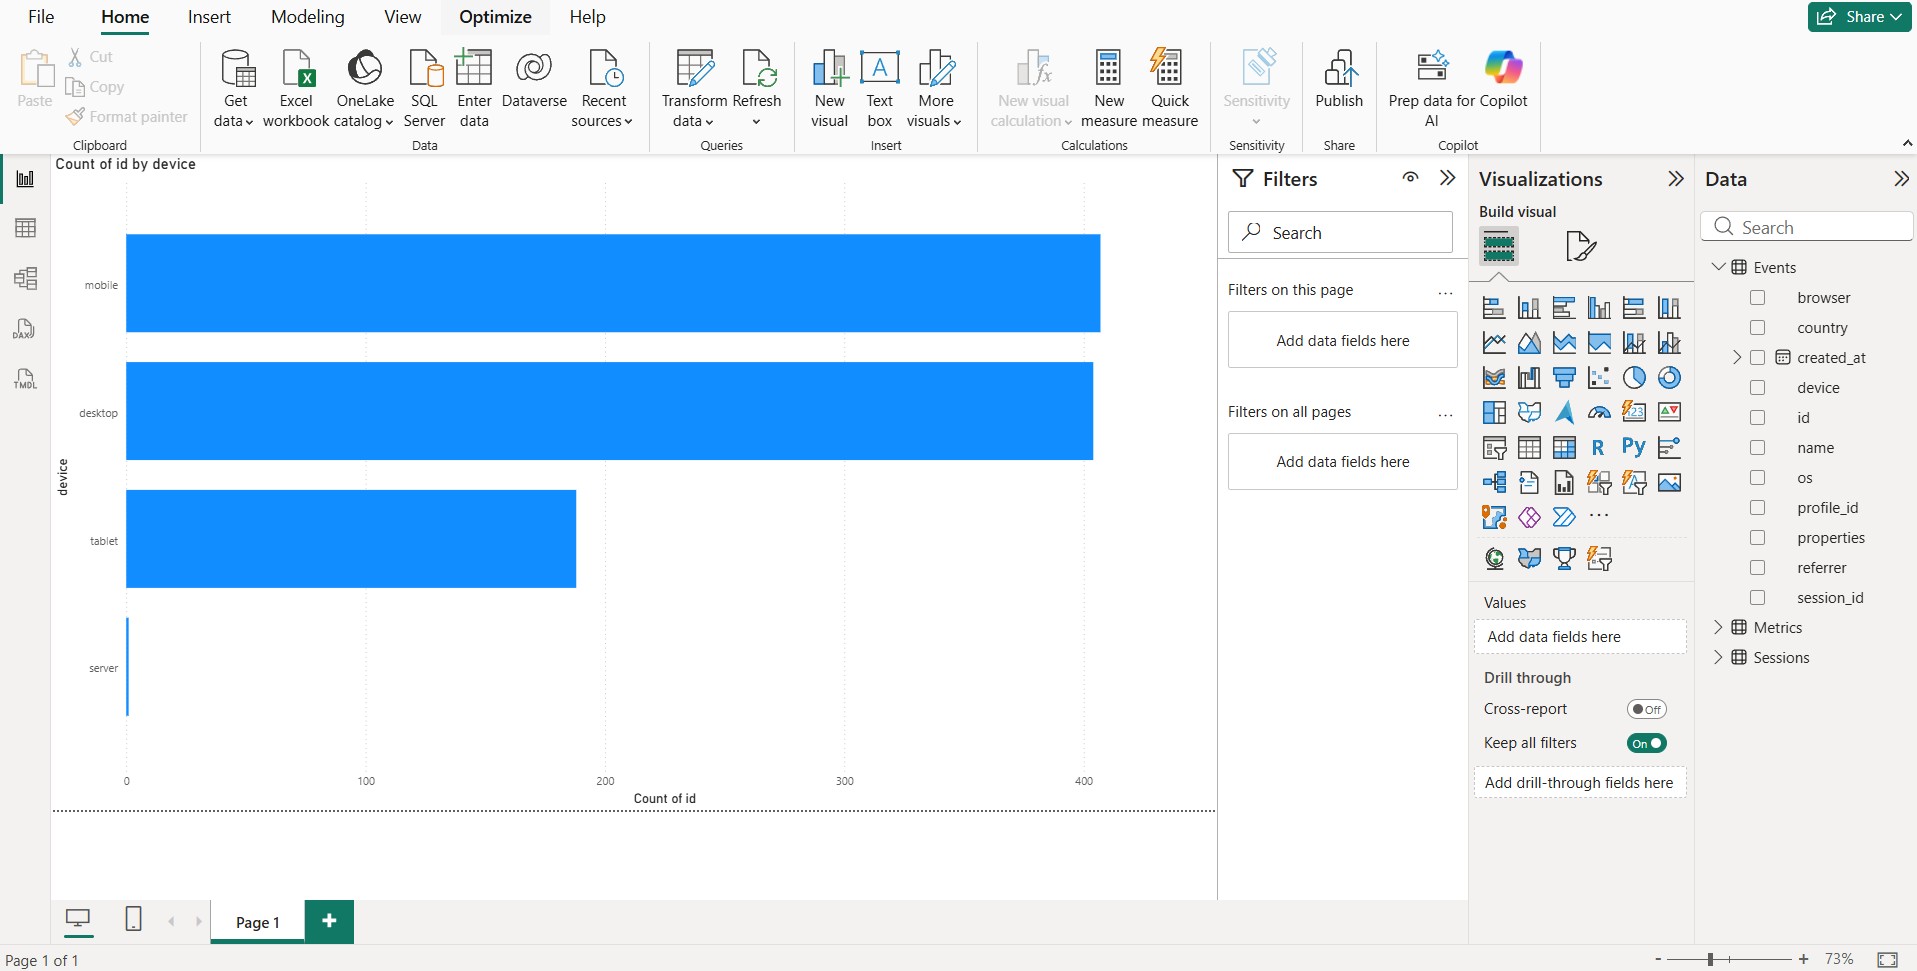
Select the stacked bar chart visual, then drag and drop the 'device' field into the Y-axis and the 'id' field into the X-axis to generate the chart.
Building an Events Bar Chart
- Select the Stacked Bar Chart visual from the Visualizations pane.
- From the Data pane, expand the Events table.
- Drag and drop the
devicefield into the Y-axis well. - Drag and drop the
idfield into the X-axis well. - Right-click the
idfield in the X-axis well and select Count (Distinct). The chart will instantly populate.
6. Publishing and Scheduled Refresh
To share your report or embed it in Flash Analytics, it must be published to the cloud workspace.
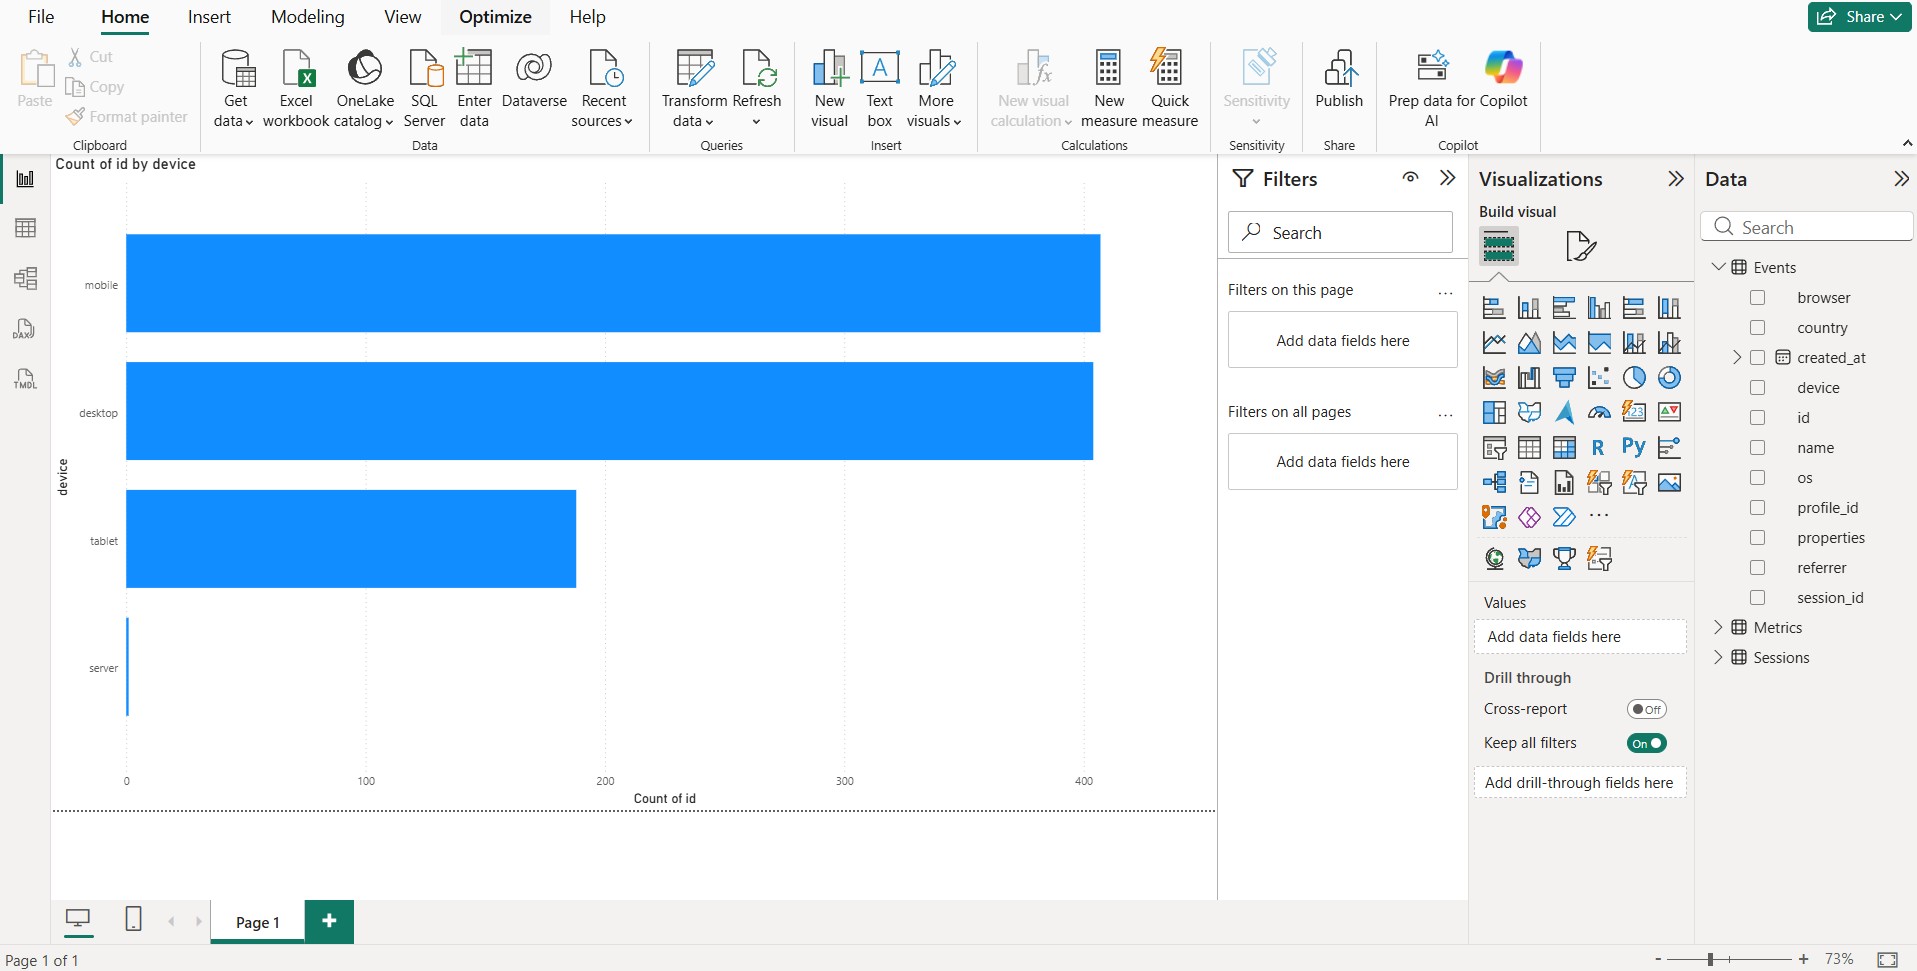
After saving your report locally, click the "Publish" button located in the Home ribbon.
- After saving your report locally, click the Publish button located in the Home ribbon.
- Select My workspace (or your designated team workspace) as the destination for the published report.
- Once the success message appears, click the link to open the report in Power BI Service. This will launch your browser where you may need to sign in.
- In Power BI Service, locate your dataset Semantic Model, click the three dots (...), and select Settings to enable cloud-based data refreshes.
- Expand Data source credentials and click Edit credentials.
- Set the Authentication method to Basic, input your
readclient ID and secret again, and save. - Expand the Refresh section to configure a daily update schedule.
Caveat: Power BI separates Desktop connections from Cloud connections. You must re-authenticate your semantic model in the web browser before scheduled refreshes can run.
7. Embedding Dashboards
Keep your analytics workflows unified by bringing your finished Microsoft reports back into Flash Analytics.
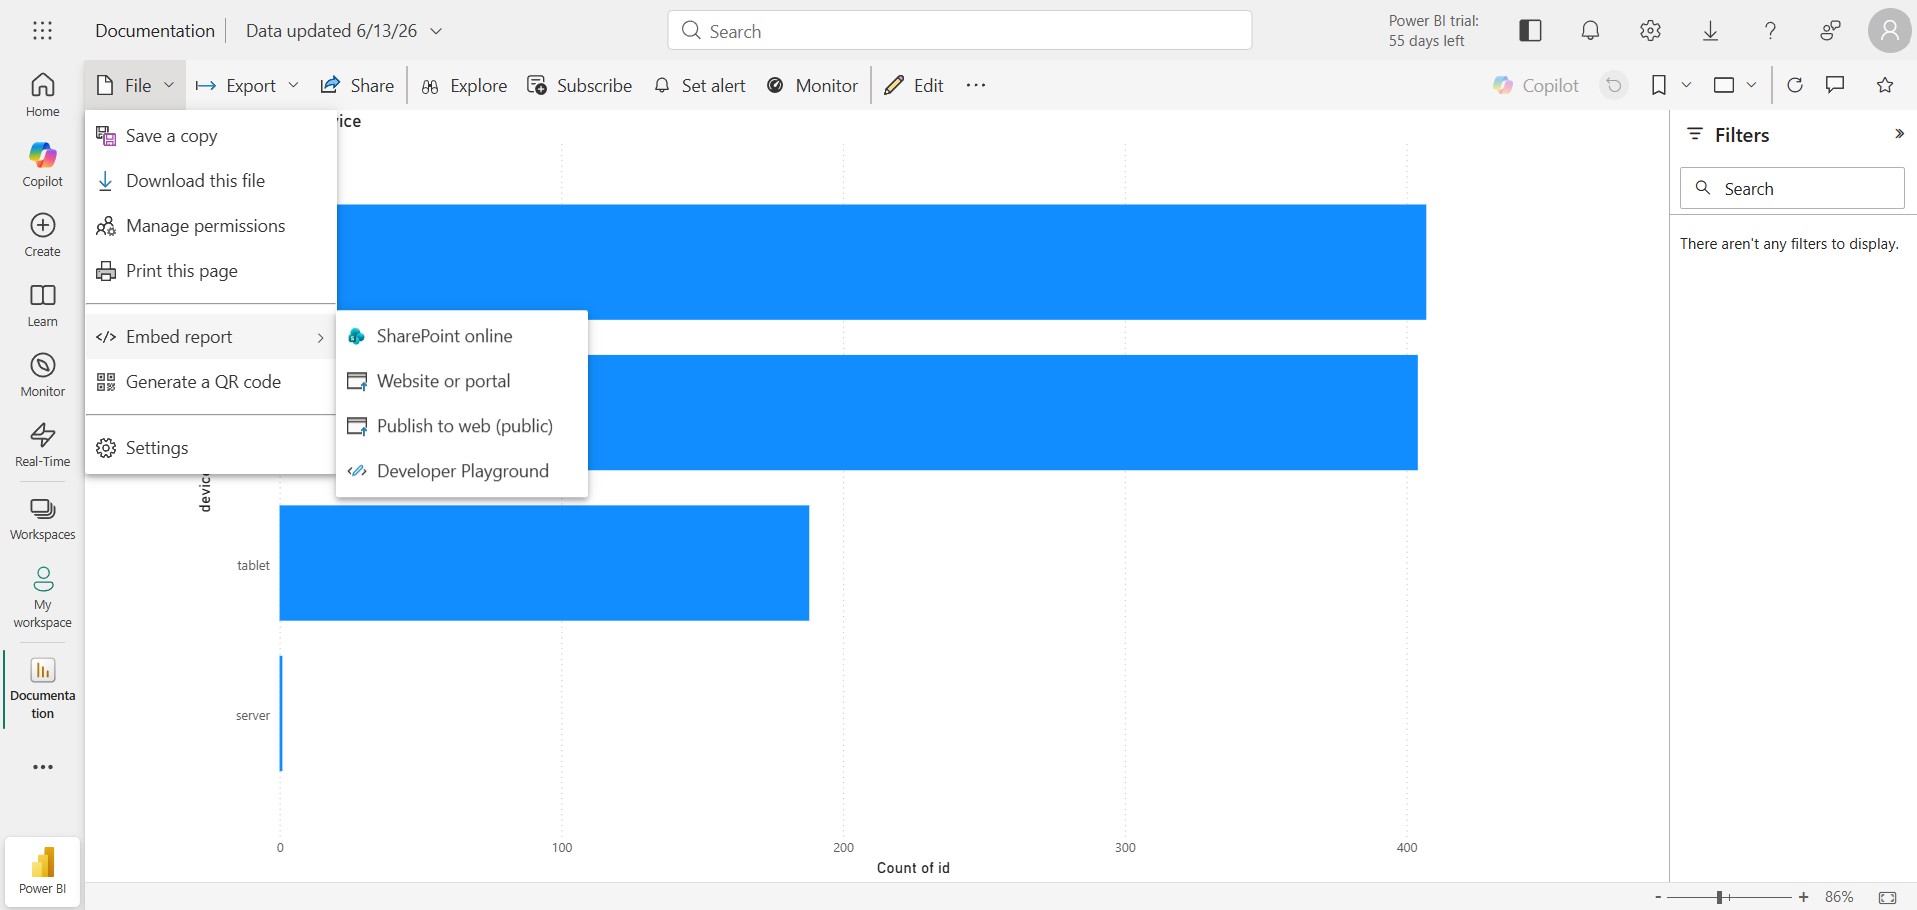
In Power BI Service, open the File menu in the top left, select "Embed report", and click "Website or portal".
- In Power BI Service, open the File menu in the top left, select Embed report, and click Website or portal.
- Copy the secure URL provided in the "Link you can use to embed content" field.
- Return to Flash Analytics, open the BI tab in the sidebar, and click New under Saved Embeds.
- Enter a name, select Power BI as the type, and paste your copied URL.
- Click Save. Select your newly saved embed from the list and follow the prompt to sign in. Your interactive report will render directly in the dashboard.
8. Troubleshooting and Best Practices
Common Errors
| Symptom | Cause | Resolution |
|---|---|---|
| 401 Unauthorized during OData connection | Using a write client, invalid secret, or wrong project scope. | Generate a new read client specifically scoped for the target project. |
| "Can't edit this semantic model on the web" | Power BI Web limitation for specific OData feeds. | All data modeling and relationship building must be done in Power BI Desktop before publishing. |
| Charts appear completely blank | Fields are added but not aggregated. | Ensure numeric or ID fields have an aggregation applied (e.g., Count, Sum) within the Visualizations pane. |
Best Practices
- Clear Cached Credentials: If Power BI Desktop skips the login screen and instantly fails, go to File -> Options and settings -> Data source settings -> Global permissions, and clear the previously saved permissions for the Flash Analytics URL.
- Use Metrics for Speed: Raw Events tables can become massive over time. Whenever possible, build high-level dashboards using the pre-aggregated Metrics table to ensure extremely fast loading times in Power BI Service.
- Parse JSON carefully: The
propertiescolumn in the Events table contains stringified JSON. Use the Power Query Editor to extract specific keys into their own columns before loading the data into your model.