Funnels & Conversions - User Guide
Flash Analytics Funnels and Conversions let you measure how users progress through a sequence of events, identify where they drop off, and track conversion trends over time.
Flash Analytics Funnels and Conversions let you measure how users progress through a sequence of events, identify where they drop off, and track conversion trends over time. Both use the same underlying funnel engine but visualize the results differently.
Table of Contents
- Overview - Funnel vs Conversion
- Creating a Report
- Series - Adding Events
- Breakdowns
- Funnel Settings
- Funnel Chart - Step-by-Step Analysis
- Conversion Chart - Trend Over Time
- Filters and Date Range
- Exporting Data
- Caveats and Gotchas
1. Overview - Funnel vs Conversion
| Chart Type | Question it answers | Visual |
|---|---|---|
| Funnel | Where in my event sequence are users dropping off? | Bar chart, one bar per step |
| Conversion | How is my overall conversion rate changing over time? | Line chart, one point per time period |
Use Funnel when you want to diagnose which step loses the most users. Use Conversion when you want to track whether your overall conversion rate is improving or degrading.
2. Creating a Report
From any project, click Reports in the sidebar, then New Report.
Select Funnel or Conversion as your Chart Type from the top toolbar. You can switch between the two at any time without losing your event configuration.
The report opens in draft mode. Changes apply live in the preview. Click Save to persist it.
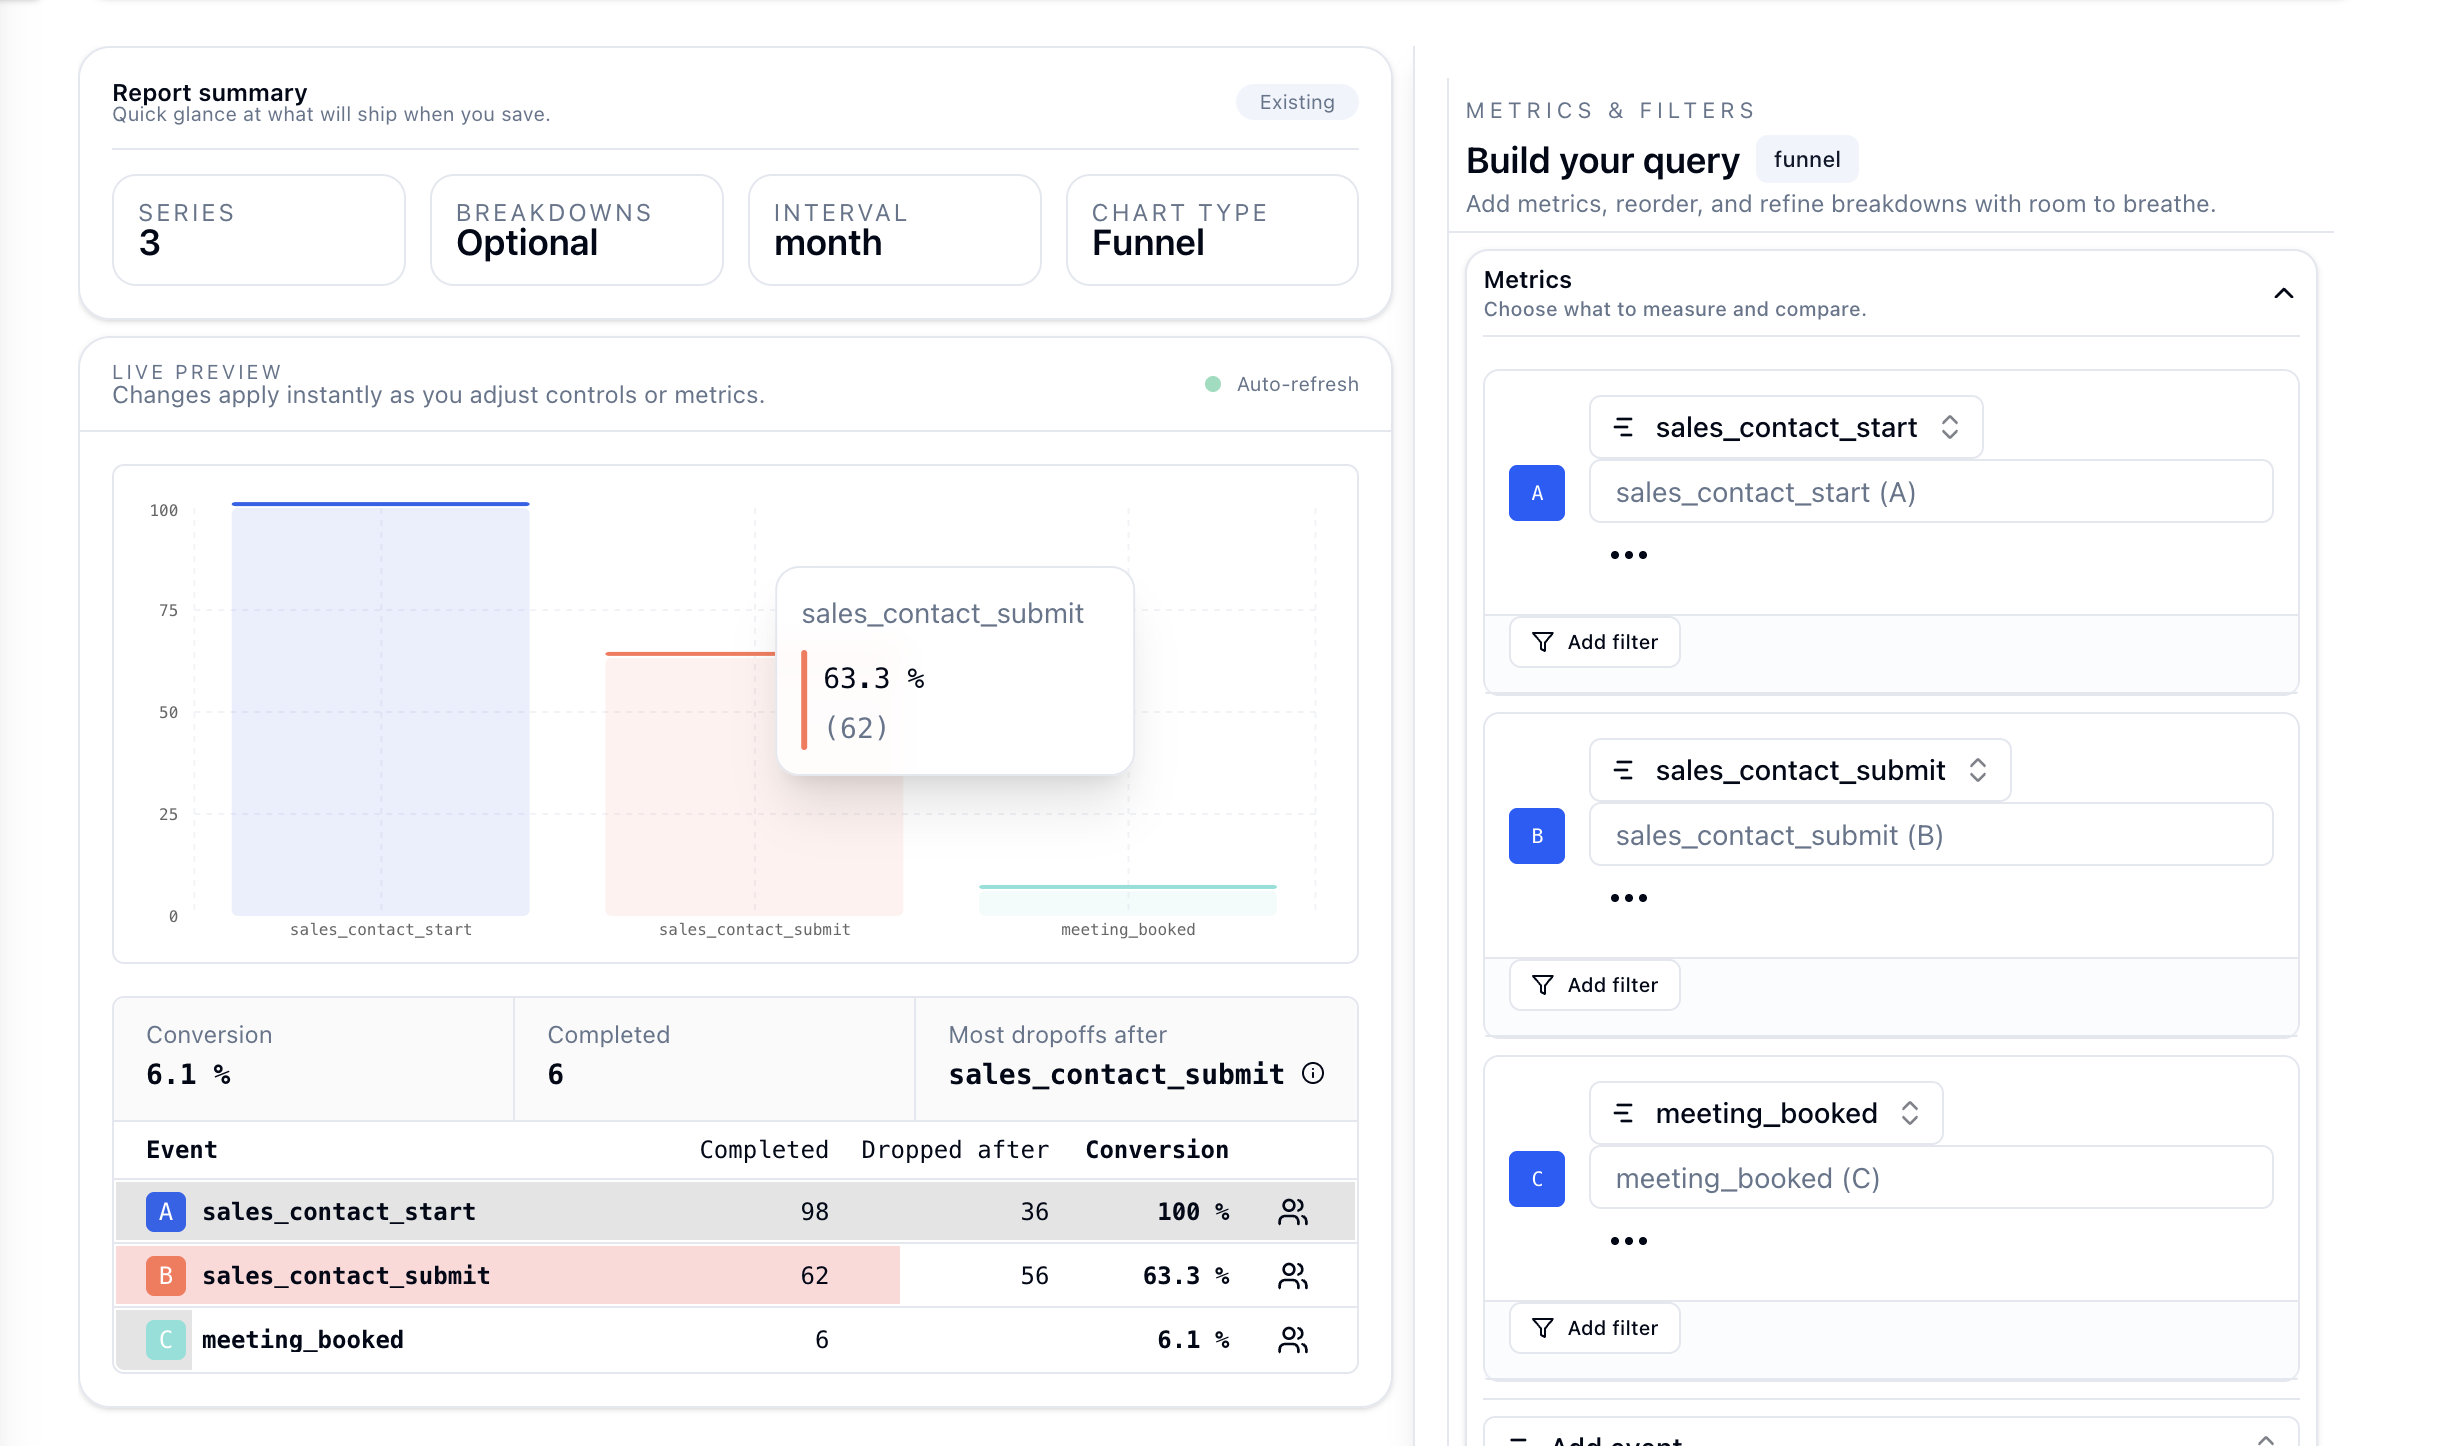
3. Series - Adding Events
Click Add event... in the Metrics section of the right sidebar.
Each event you add becomes one step in the funnel, evaluated in order.
- Drag to reorder steps.
- Use the filter icon on any step to add property filters.
- Use the trash icon to remove a step.
Minimum: At least 2 events are required before any chart data is shown. The preview stays in a placeholder state until you add a second event.
Caveat: Steps must occur in order. A user must fire event 1 before event 2 is counted, event 2 before event 3, and so on. Events that happen out of order do not count toward funnel progression.
4. Breakdowns
Click Add breakdown in the Breakdowns section to split results by a property.
Supported breakdown dimensions include system columns such as country, os, device, region, and browser, plus any properties.* key from your events.
- In Funnel charts, each breakdown value gets its own funnel bar group and summary card.
- In Conversion charts, each breakdown value gets its own line on the time-series chart.
Caveat: High-cardinality breakdowns such asuserIdcan produce too many lines or groups and make the chart unreadable. Prefer small, meaningful sets such asplan,country, ordevice.
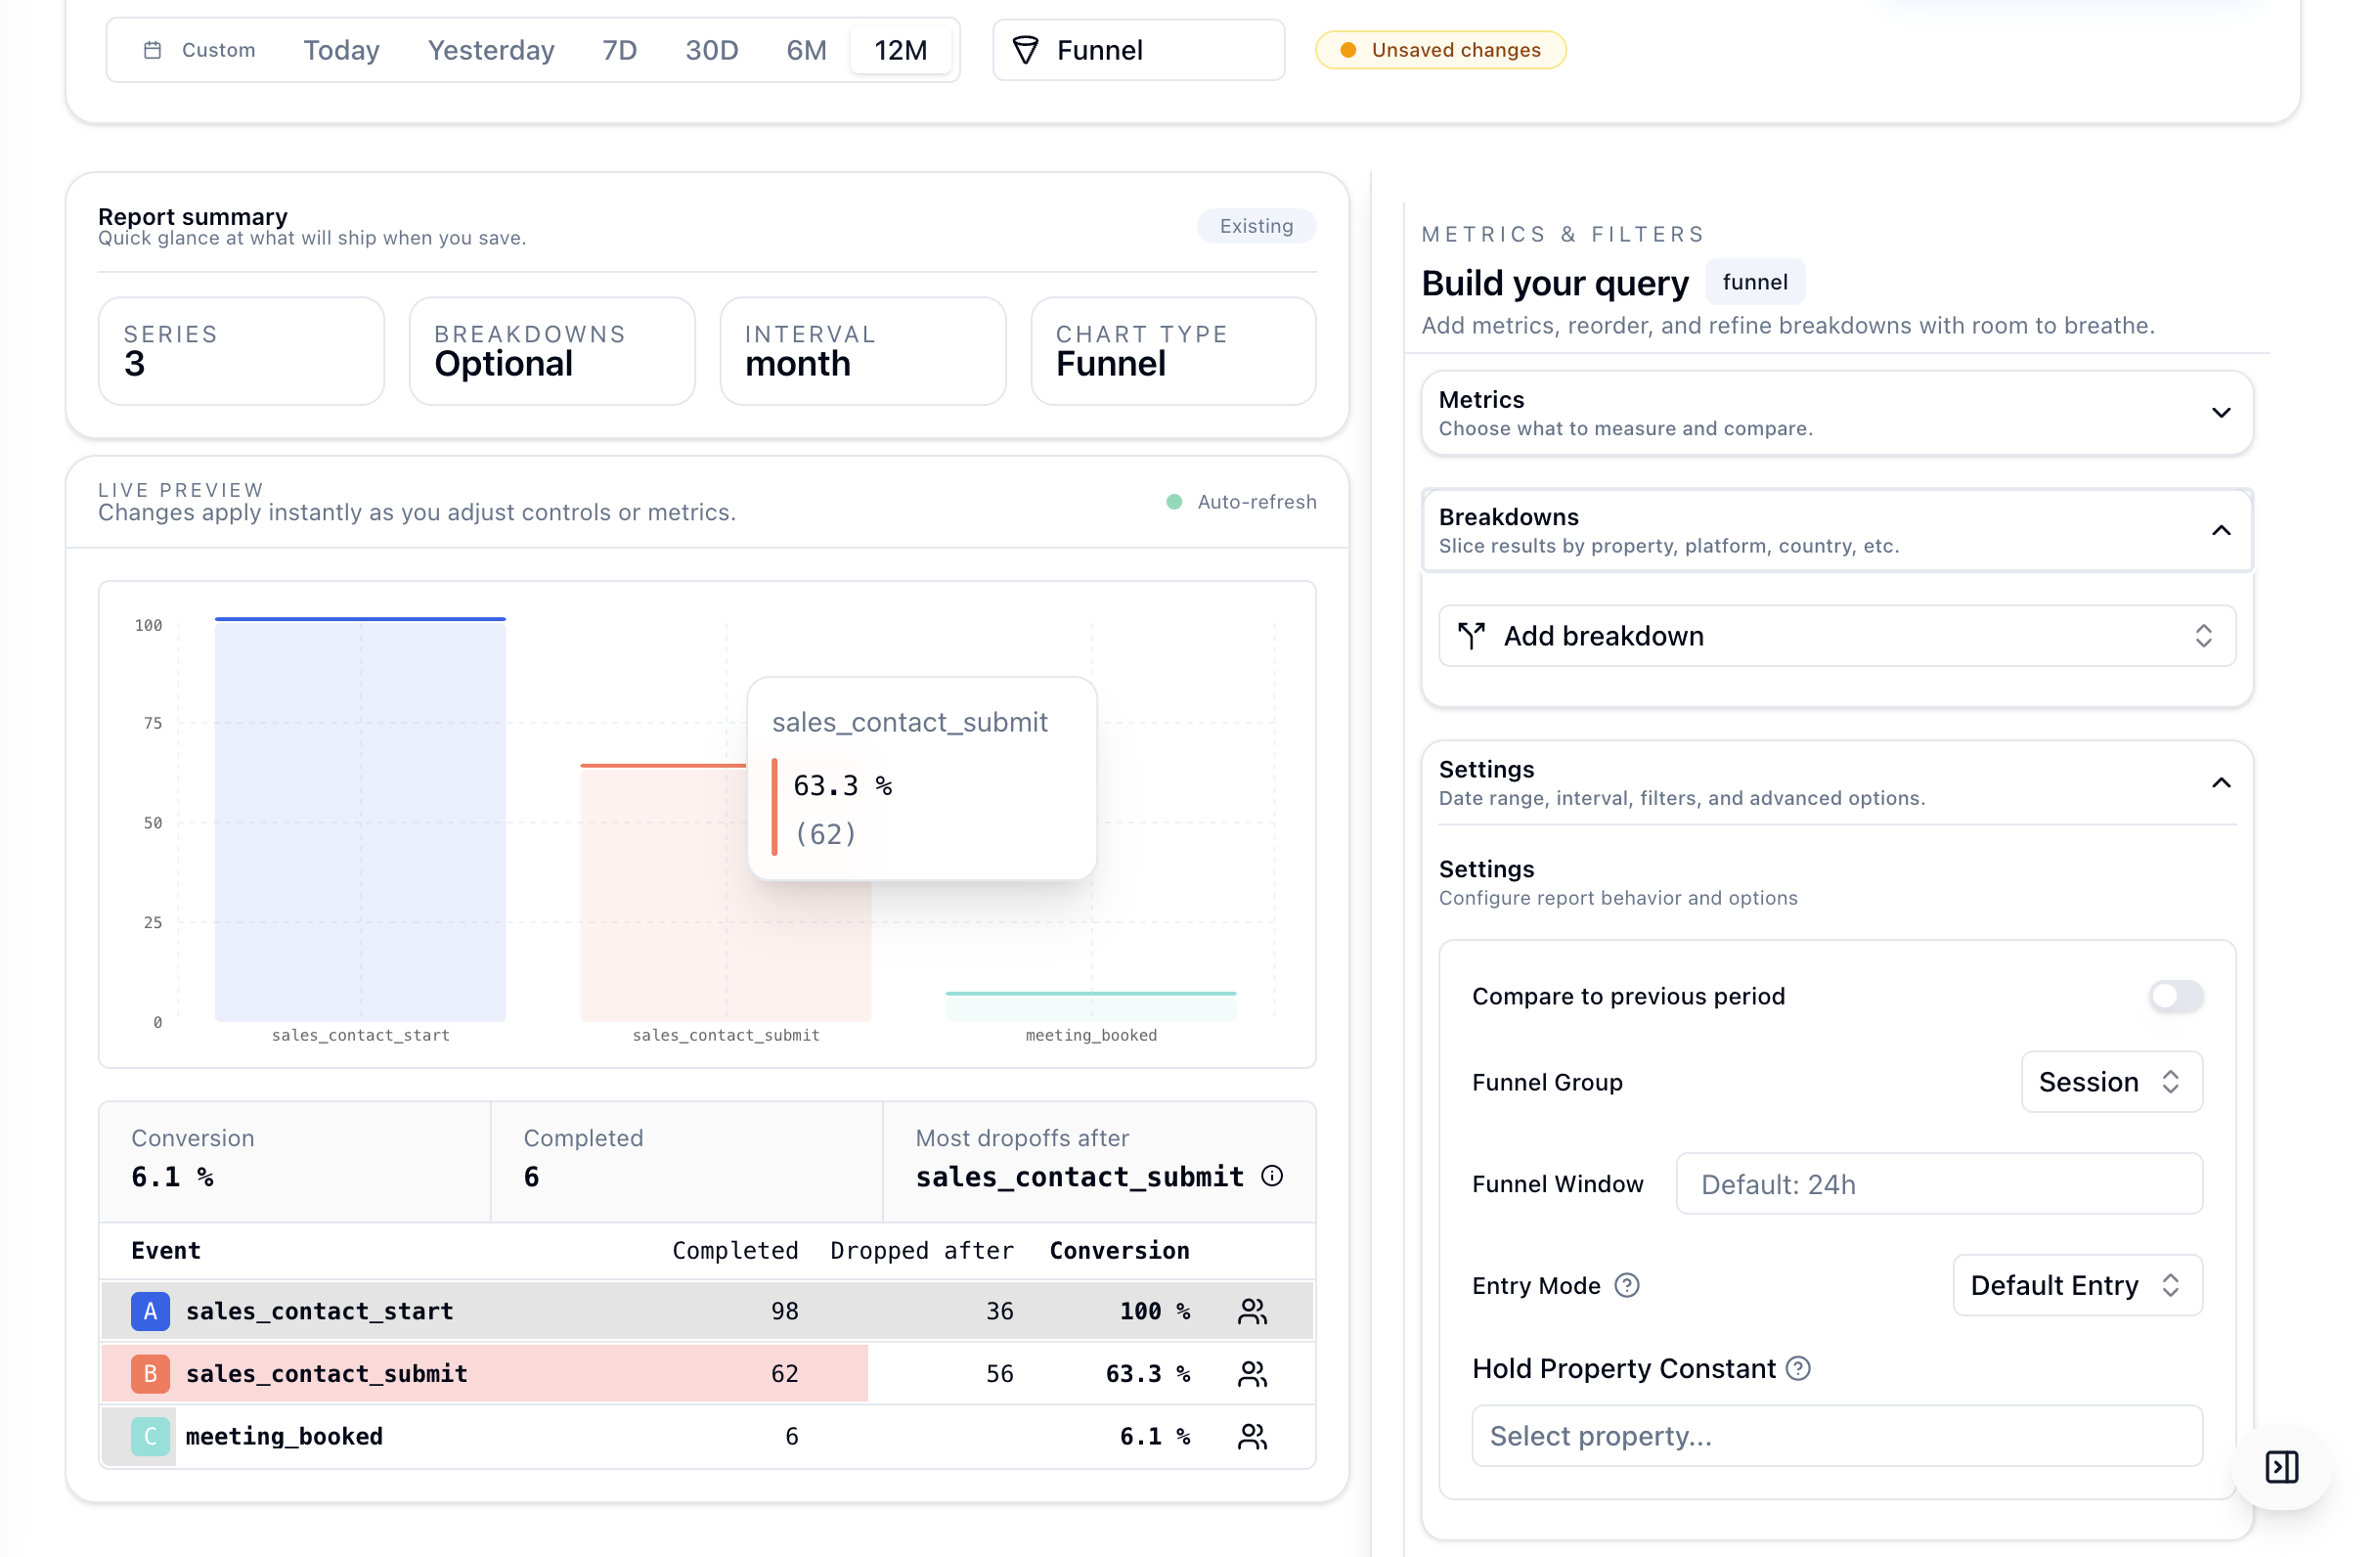
5. Funnel Settings
These settings appear in the Settings section of the sidebar for both Funnel and Conversion chart types.
Funnel Group
| Option | When to use |
|---|---|
| Session (default) | Steps must all occur within the same session. Best for single-visit flows such as add to cart to purchase. |
| Profile | Steps can span multiple sessions attributed to the same user. Best for longer multi-day funnels such as signup to first purchase. |
Funnel Window
The maximum time allowed between the first step and the last step. The default is 24 hours.
- Enter a number of hours. For example,
168means 7 days. - A user who completes step 1 but does not reach the final step within this window is counted as a dropout.
Caveat: Funnel Window applies from the moment the first event fires, not between consecutive steps. If step 1 happens at hour 0 and step 3 happens at hour 25, the funnel does not convert when the window is 24 hours.
Entry Mode
| Mode | Behavior |
|---|---|
| Default Entry | One active conversion attempt per subject. Only the first occurrence of step 1 is used as the entry point. |
| Optimized Re-entry | Multiple conversion attempts allowed. Each occurrence of step 1 starts a new attempt, and the best matching sequence is used. |
Example event order: A -> B -> A -> C
- Default Entry: one attempt starting from the first
A. It countsA -> Bbut the final step is not reached in sequence. - Optimized Re-entry: two attempts. The second attempt
A -> Cbecomes the full conversion.
Hold Property Constant
This forces all events in the funnel to share the same value for a chosen property, captured from step 1.
- Click Select property... to choose a property key.
- Once set, a user only counts as having completed later steps if the property value matches step 1.
Example: set the property to platform. If step 1 happens on platform=iOS, steps 2 and 3 must also be on platform=iOS.
Caveat: If the chosen property is not present on an event, that event is excluded from the funnel entirely.
Compare to Previous Period
Toggle this on to overlay the equivalent previous time window on the chart for direct comparison, such as this week versus last week.
6. Funnel Chart - Step-by-Step Analysis
Summary Cards
| Card | What it shows |
|---|---|
| Highest conversion rate | The breakdown value with the best final-step conversion percentage. |
| Most conversions | The breakdown value with the most completed journeys by absolute count. |
Funnel Bar Chart
Each breakdown has its own grouped bar set. Bars show the percentage of entrants who reached each step.
Detailed Table
| Column | Description |
|---|---|
| Conversion | Percentage of entrants who completed all steps. |
| Completed | Absolute count of subjects who reached the final step. |
| Most dropoffs after | The step where the largest number of subjects exited, highlighted in red. |
Step-by-Step Table
| Column | Description |
|---|---|
| Event | The step event name. |
| Completed | Count of subjects who reached this step. |
| Dropped after | Count of subjects who exited after this step and did not proceed. |
| Conversion % | Percentage of step-1 entrants who reached this step. |
| View users | Inspect the cohort who completed this step. |
Caveat: Conversion percentage on each step is always relative to the initial entry count, not the previous step. A step showing 50 percent means half of all entrants reached it.
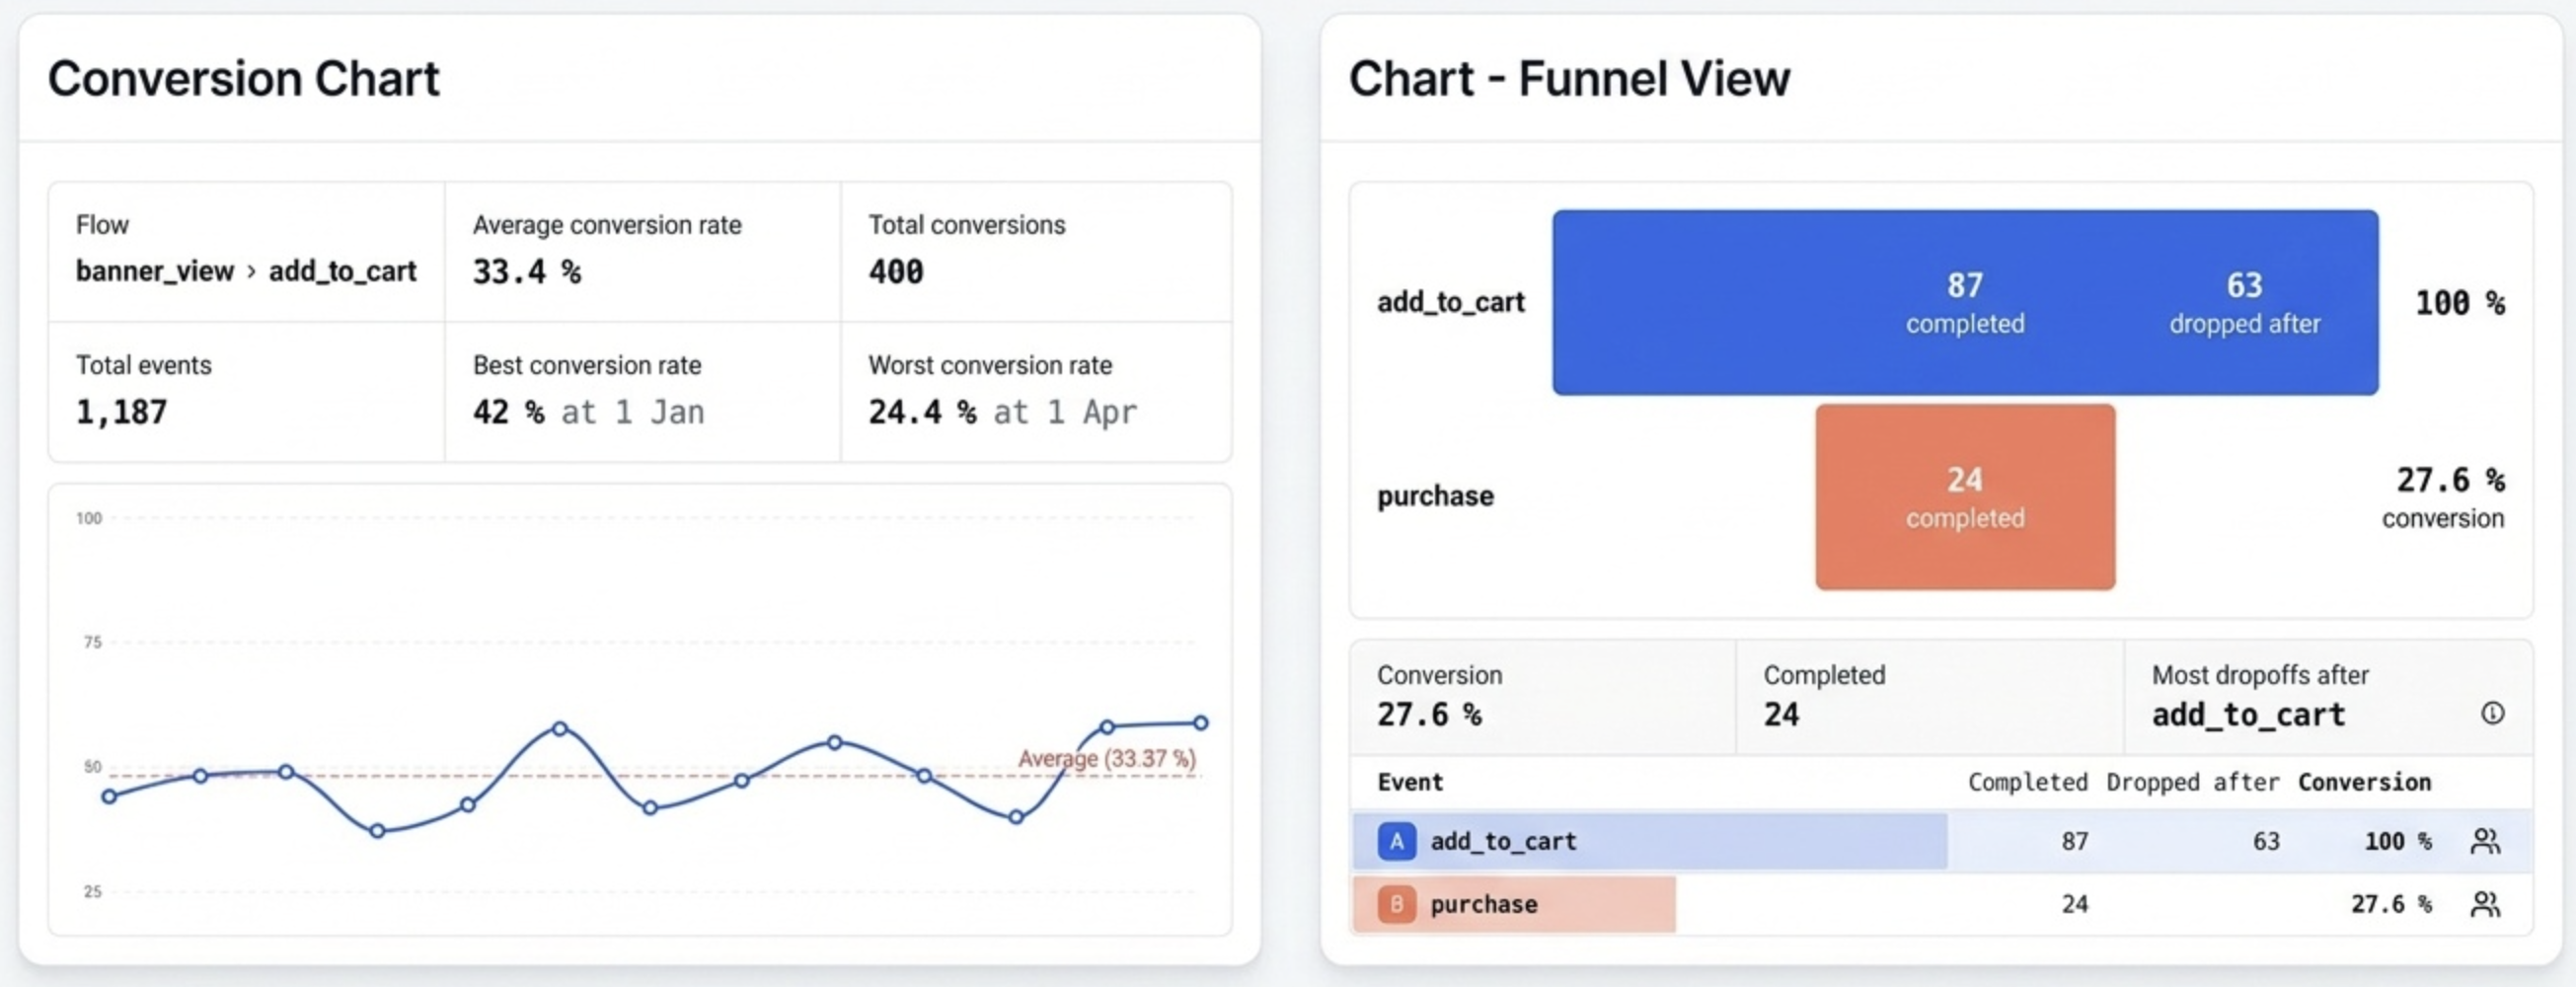
7. Conversion Chart - Trend Over Time
Summary Cards
| Card | Description |
|---|---|
| Flow | The event sequence shown as a breadcrumb such as A to B to C. |
| Best breakdown (avg) | Breakdown with the highest average conversion rate over the period. |
| Worst breakdown (avg) | Breakdown with the lowest average conversion rate over the period. |
| Average conversion rate | Overall average across all data points in the period. |
| Total conversions | Sum of all completed sequences across the period. |
| Total events | Sum of all step-1 entries used as the denominator. |
| Best conversion rate | Peak rate achieved, with date and breakdown. |
| Worst conversion rate | Lowest rate observed, with date and breakdown. |
Line Chart
- One line per breakdown value, or one line if no breakdown is set.
- X-axis is time, bucketed by hour, day, week, or month.
- Y-axis is conversion rate from 0 to 100 percent.
- A dashed horizontal line shows the average rate for the period.
- When Compare to previous period is enabled, a faded reference line shows the prior period trend.
Conversion Table
Below the chart, a sortable table shows the full breakdown.
- Serie: the breakdown value, or Conversion when no breakdown is set.
- Avg Rate: average conversion rate for that breakdown.
- Total / Conversions: entry count and conversion count.
- Date columns: one column per date bucket with the rate for that period.
Click any column header to sort. Use the search box to filter rows. Check or uncheck a row's checkbox to show or hide that line on the chart.
8. Filters and Date Range
Date Range
Use the date range picker in the top toolbar to set the analysis window. Presets such as 7d, 30d, and 90d are supported alongside a custom start and end date picker.
Interval
| Interval | When to use |
|---|---|
| Hour | High-traffic flows where intraday variation matters. |
| Day | Best for most analyses. |
| Week | Useful for long-running campaigns or multi-week funnel windows. |
| Month | Best for macro trend analysis. |
Note: The Funnel bar chart is not affected by interval. It aggregates across the full selected date range. Only the Conversion chart uses interval for time-series rendering.
9. Exporting Data
Click the Export button at the top right of the chart area to download:
- CSV for table data, including step metrics or time-series rates.
- PNG or PDF for the rendered chart as displayed.
10. Caveats and Gotchas
Steps must be ordered
Funnel progression is strictly ordered. If a user fires step 3 before step 2, step 3 is ignored for that conversion attempt.
A subject is counted once per entry attempt
A user who completes the full funnel five times counts as five conversions only in Optimized Re-entry mode. In Default Entry mode, only the first entry counts.
Conversion rate is final-step only
Both the Funnel summary card and the Conversion chart measure conversion as: completed all steps divided by subjects who fired step 1.
Breakdowns are applied at the event level
If a breakdown dimension such as country changes between steps, the value used is determined at the subject level based on the first observed value. This behavior depends on how your events are enriched.
Funnel Window starts at step 1
The clock starts when step 1 fires and does not reset between steps. Longer funnels need a large enough window to avoid undercounting.
Minimum 2 events required
Adding fewer than two events results in a placeholder state. No data is queried until the minimum is met.